Ethereum Price Analysis of March 3, 2025: Resistance Test at $2,550 Raises Breakout Hopes
0
0

Let’s Dive into the Ethereum Price Analysis of March 3 to understand ETH’s market trends and investment potential in 2025.
The crypto market remains highly volatile, and Ethereum is no exception. ETH price today is fluctuating as traders assess key levels to anticipate its next move. While some recovery attempts have emerged, uncertainty in the market keeps investors cautious. Factors like liquidity shifts, broader market sentiment, and technical signals continue to influence its price action. Traders are closely watching whether it can regain bullish momentum or face another pullback. Let’s analyze the past 24 hours of price movement to understand where it might be headed next.
Ethereum Surges to $2550 Before Facing Reversal
ETH price today began with a moderate trading range. At 3:00 UTC, a golden cross on the MACD line signaled an upward trend, pushing the price into an upward channel. The price maintained an upward trajectory until overbought conditions at 9:30 UTC led to further fluctuations. However, at 10:40 UTC, a death cross appeared, starting a downward trend. The price continued to decline, finding support at $2172.51 due to oversold at 14:15 UTC. At 14:50 UTC, a golden cross on the MACD line reversed the trend, sparking an upward movement.
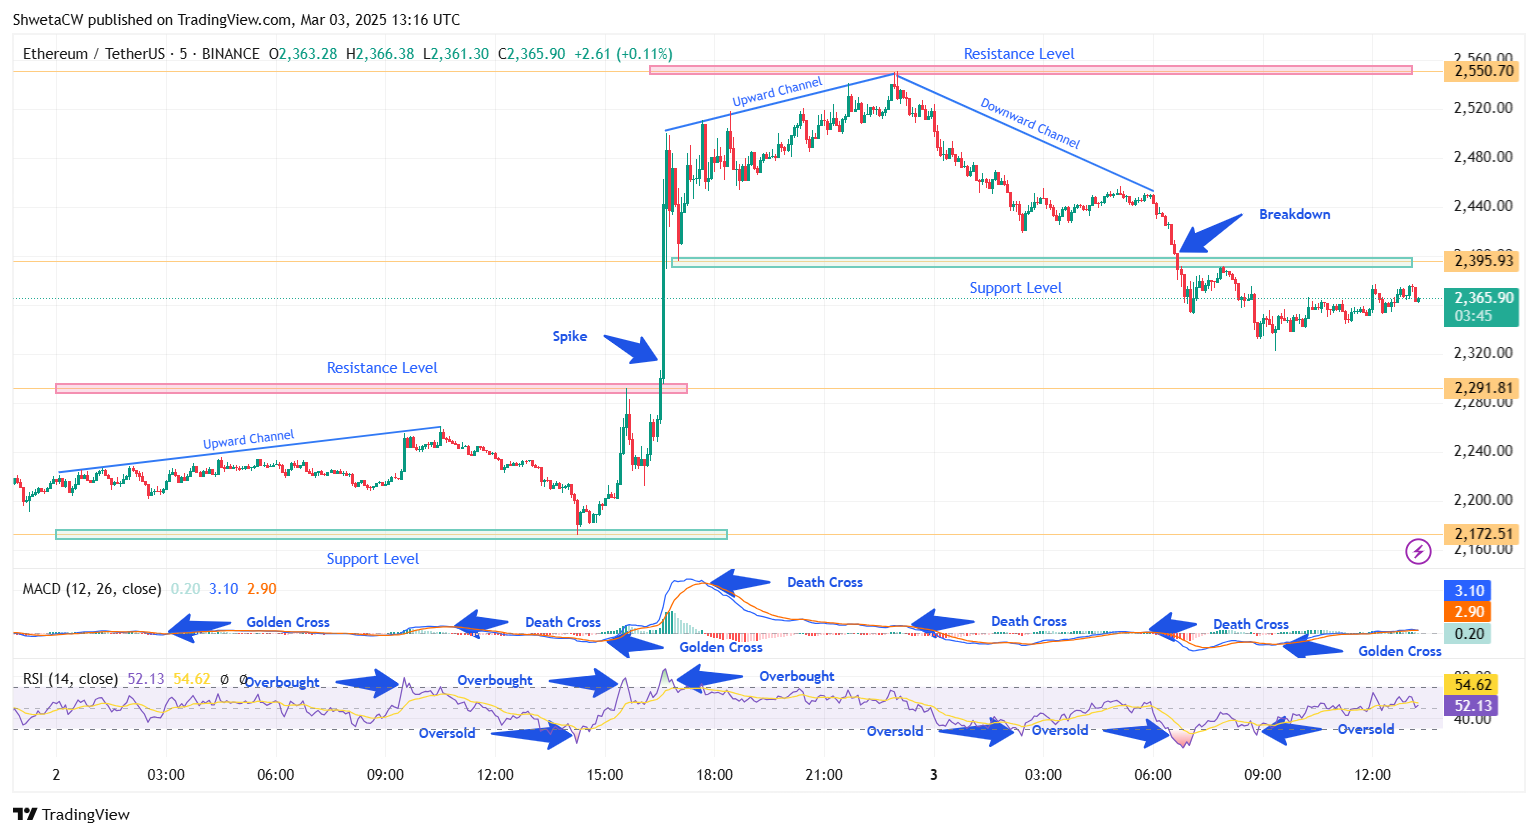
Chart 1, Analyzed by ShwetaCW, published on TradingView, March 3, 2025
An overbought at 15:35 UTC led the price to find resistance at $2291.81. However, strong buying momentum caused the price to break past this level, establishing a new trading range. As the price reached higher, it found a new support at $2395.93. At 17:50 UTC, a death cross suggested a potential reversal, but the price continued in an upward channel, reaching $2550.70. Shortly after, at 23:15 UTC, a death cross appeared, starting a downward trend. The price began declining, forming a downward channel that signaled a shift in momentum as the day ended.
Ethereum Price Analysis of March 3: ETH Faces Early Decline Before Stabilizing
The trading day of March 3 started with a downward trend due to the previous session’s death cross. At 2:20 UTC, oversold on the RSI pushed the price lower. A death cross on the MACD line at 6:00 UTC signaled further decline. That was confirmed by an oversold condition at 6:40 UTC, causing the price to break its support. The price continued fluctuating downward, with another oversold at 8:50 UTC. However, a golden cross at 9:20 UTC suggested a potential reversal, leading to a moderate trading range.
Ethereum Next Move
Over the past 24 hours, Ethereum has seen both an upward breakout and a breakdown. From this point, the price could surpass the $2,395.93 resistance. It could enter a trading range, targeting the next resistance at $2,550.70. However, failure to break above this level may lead to consolidation or a potential decline. If the price stays below $2,395.93, it risks falling toward the $2,291.81 support. Traders should watch key levels closely. Market sentiment and technical indicators will determine whether it regains bullish momentum or faces further downward pressure.
The post Ethereum Price Analysis of March 3, 2025: Resistance Test at $2,550 Raises Breakout Hopes appeared first on Coinfomania.
0
0


 从同一位置管理所有加密资产、NFT 和 DeFi 资产
安全地关联您正在使用的投资组合,以开始交易。