Algorand price prediction 2024-2030: Is a resurgence possible?
2d ago•

bullish:
0
bearish:
0
Share
Key takeaways
- Our Algorand price predictions anticipate a high of $0.1624 by the end of 2024.
- In 2025, it will range between $0.2331 and $0.2968, with an average price of $0.2401.
- In 2030, it will range between $1.50 and $1.76, with an average price of $1.54.
Algorand’s capabilities make it an interesting prospect for investors and developers interested in smart contracts and blockchain interoperability. A 2019 video featured Gary Gensler, Securities and Exchange Commission chair, referring to Algorand as a great technology and using it as an example when discussing the decentralization of cryptocurrencies.
Will ALGO go up? Can it reach $10? Where will ALGO be in 5 years? We explore these and more in our Cryptopolitan price prediction.
Overview
| Current price | Algorand |
| Ticker | ALGO |
| Current price | $0.1358 |
| Market cap | $1,123,914,655 |
| Trading volume | $36,965,449 |
| Circulating supply | 8,226,809,191 |
| All-time low | $0.08761 on Sep 11, 2023 |
| All-time high | $3.28 on Jun 11, 2019 |
| 24-hour high | $0.1451 |
| 24-hour low | $0.1334 |
Algorand price prediction: Technical analysis
| Metric | Value |
| Volatility (30-day variation) | 6.16% |
| 50-day SMA | $0.1498 |
| 200-day SMA | $0.1943 |
| Sentiment | Bearish |
| Fear and greed index | 68 (Greed) |
| Green days | 18/30 (60%) |
ALGO price analysis: ALGO extends bearish run
Key takeaways:
- The candles have formed a black crow pattern, a bearish continuation pattern that could signal a bearish outbreak.
- The MACD indicator has been red for three days, further cementing a bearish stance.
ALGO/USD 1-day chart: ALGO signals a drop lower
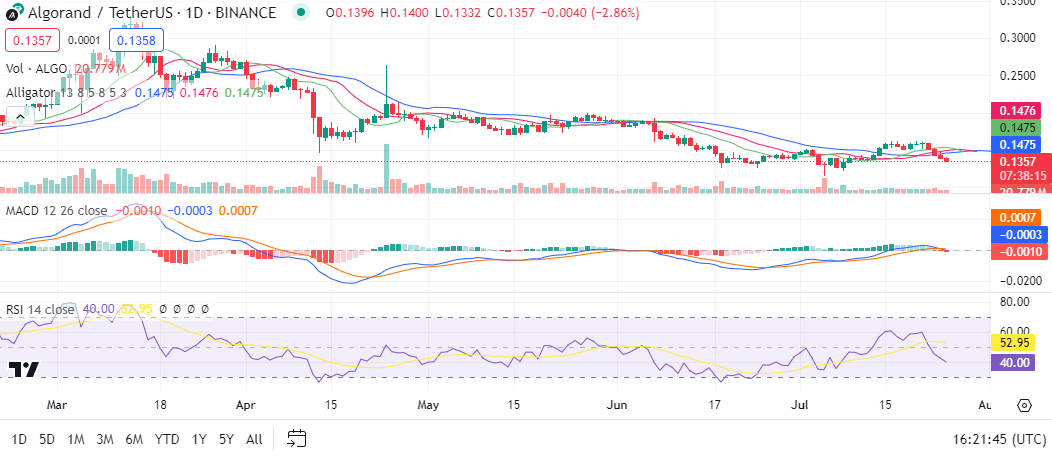
ALGO price analysis for July 25. This chart shows ALGO’s drop from March after it reached a high of $0.3299. At first, the drop was drastic, then slowed from May. The William Alligator trendlines show it is in consolidation as it trades sideways with little volatility. The relative strength index is at 40 in neutral territory, so there is plenty of room for price movement in either direction. Notably, the candles have formed a black crow pattern, a bearish continuation pattern that could signal a bearish outbreak.
ALGO/USD 4-hour chart: ALGO ends bullish run
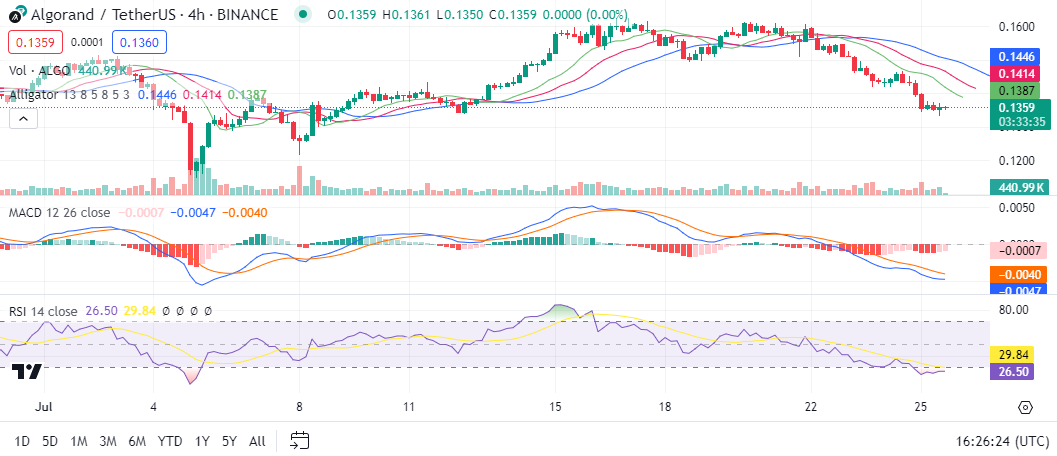
Unlike the daily chart, this chart shows ALGO’s bullish run this month, rising from $0.1146 to $0.1612. However, the bullish run has ended, as shown by the William Alligator trendlines, which curve downwards with rising volatility. The RSI has also been downward and now stands at 27.21 in oversold territory. The MACD indicator has been red for three days, further cementing the bearish stance.
ALGO technical indicators: Levels and action
Daily simple moving average (SMA)
| Period | Value ($) | Action |
| SMA 3 | 0.1438 | SELL |
| SMA 5 | 0.1465 | SELL |
| SMA 10 | 0.1525 | SELL |
| SMA 21 | 0.1480 | SELL |
| SMA 50 | 0.1498 | SELL |
| SMA 100 | 0.1696 | SELL |
| SMA 200 | 0.1943 | SELL |
Daily exponential moving average (EMA)
| Period | Value ($) | Action |
| EMA 3 | 0.1465 | SELL |
| EMA 5 | 0.1443 | SELL |
| EMA 10 | 0.1431 | SELL |
| EMA 21 | 0.1485 | SELL |
| EMA 50 | 0.1640 | SELL |
| EMA 100 | 0.1786 | SELL |
| EMA 200 | 0.1828 | SELL |
Is ALGO a good investment?
Analysis by Intotheblock shows that 93% of holders are at a loss at the current price. The figure will likely drop lower in the short term. However, as our Cryptopolitan price prediction shows, this will change over the long term.
Why is ALGO up?
ALGO has registered growing positive momentum over the last seven days. This move comes as ALGO seeks the direction of the next breakout. The RSI also trends higher, hinting that ALGO will go up.
Will ALGO recover?
ALGO is recovering over the short term; however, the move is gradual. The general trend remains bearish as it seeks support.
Will ALGO reach $0.15?
ALGO’s immediate resistance level stands at $0.15. With the positive market momentum rising, a breakout is highly probable.
Will ALGO reach $10?
Per our Cryptopolitan price prediction, it remains highly unlikely for ALGO to break above $10 in the period ending 2030.
Will ALGO reach $100?
At $100, Algorand market capitalization has to rise above $700 billion form the current $1.2 billion. In comparison, Ethereum’s market capitalization is at $400 billion. Per our price prediction, Algorancd is highly unlikely to reach $100.
Does ALGO have a good long-term future?
Like most mega-altcoins, Algorand is trading at its lowest level this year. A break below 30 RSI will be crucial to sending it to previous highs. Looking ahead, ALGO will register new all-time highs in coming years.
What can you expect from the ALGO price analysis next?
Per our technical indicators, ALGO’s sentiment is bearish, and the fear and greed index shows investors are greedy. The charts also show that the market sentiment is bearish, so ALGO should drop lower.
Recent news/updates on Algorand
Tether is discontinuing usdt support and minting on the Algorand blockchain, but will remain redeemable for the next 12 months. The decision came as Tether shifted focus to networks based on their usage, maintainability, and community interest.
Read more: Tether ceases USDT issuance on Algorand and EOS
ALGO price prediction July 2024
The Algorand price forecast in July is a maximum price of $0.1624 and a minimum price of $0.1358. The average price for the month will be $0.1483.
| Month | Potential low ($) | Potential average ($) | Potential high ($) |
| July | 0.1358 | 0.1483 | 0.1624 |
ALGO price prediction 2024
For the second half of 2024, ALGO’s price will range between $0.1358 and $0.1948. The average price for the period will be $0.1769.
| Year | Potential low ($) | Potential average ($) | Potential high ($) |
| 2024 | 0.1358 | 0.1769 | 0.1948 |
ALGO price prediction 2025-2030
| Year | Potential low ($) | Potential average ($) | Potential high ($) |
| 2025 | 0.2331 | 0.2401 | 0.2968 |
| 2026 | 0.3326 | 0.3422 | 0.4055 |
| 2027 | 0.4850 | 0.5021 | 0.5888 |
| 2028 | 0.7115 | 0.7366 | 0.8492 |
| 2029 | 1.04 | 1.07 | 1.25 |
| 2030 | 1.50 | 1.54 | 1.76 |
Algorand price prediction 2025
The ALGO price forecast for 2025 is a high of $0.2968. It will reach a minimum price of $0.2331 and average at $0.2401.
Algorand price prediction 2026
The year 2026 will experience more bullish momentum. Our ALGO price prediction estimates it will range between $0.3326 and $0.4055, with an average price of $0.3422.
Algorand price prediction 2027
Algorand’s price prediction climbs even higher into 2027. According to the prediction, ALGO’s price will range between $0.4850 and $0.5888, with an average price of $0.5021.
Algorand price prediction 2028
Our analysis indicates a further acceleration in ALGO’s price. It will trade between $0.7115 and $0.8492, with an average price of $0.7366.
Algorand price prediction 2029
According to the ALGO price prediction for 2029, the price of ALGO will range from $1.04 to $1.25, with an average price of $1.07.
Algorand price prediction 2030
The ALGO price prediction for 2030 indicates the price will range between $1.50 and $1.76. The average price of ALGO will be $1.54.

ALGO market price prediction: Analysts ALGO price forecast
| Platform | 2024 | 2025 | 2026 |
| Digitalcoinprice | $0.30 | $0.34 | $0.53 |
| Changelly | $0.20 | $0.31 | $0.46 |
| Gate.io | $0.15 | $0.15 | $0.16 |
Cryptopolitan’s ALGO price prediction
Our predictions show that ALGO will achieve a high of $0.1948 in the second half of 2024. In 2025, it will range between $0.2331 and $0.2968, with an average of $0.2401. In 2030, it will range between $1.50 and $1.76, with an average price of $1.54. Note the predictions are not investment advice. Seek independent professional consultation or do your research.
ALGO historic price sentiment
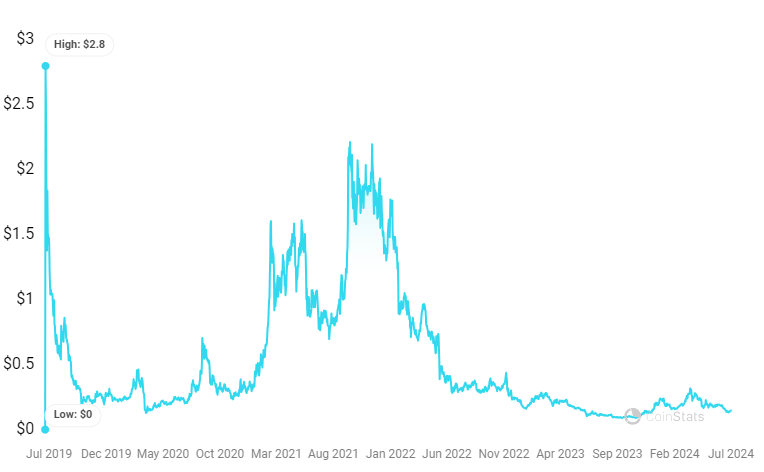
- Algorand held its token sale in June 2019 at $2.4 each.
- Union Square Ventures, Lemniscap, and NGC Ventures, among others, held earlier funding rounds. The public sale raised $60.40 million while funding rounds raised $66 million.
- Token sale participants who held their tokens since launch are down 90%.
- Binance listed ALGO on 21 June 2019. According to Coinmarketcap data, it pumped after the listing to reach its all-time high (ATH) at $3.28.
- ALGO later crashed; four months later, it was down 90% from ATH.
- In July 2021, Coinbase listed ALGO. As a result, it gradually recovered and peaked at $0.637 in August.
- In retrospect, 2021 was the golden year for the crypto market. The emergence of NFTs, DeFi growth, and institutional interest drove growth.
- So, in 2021, it rose from a low of $0.32 in January to $2.3 in October, a 200% gain.
- Nothing prepared crypto enthusiasts for the 2023 crypto winter, which worsened with the FTX crash. The year closed with ALGO trading at $0.23.
- The decline continued through 2023, registering an all-time low at $0.0876 in September.
- Market recovery began in October. By the end of the year, it had risen above $0.2. It now trades at $1.5.
2d ago•
bullish:
0
bearish:
0
Share

 Manage all your crypto, NFT and DeFi from one place
Securely connect the portfolio you’re using to start.

bullish:
0
bearish:
0


bullish:
3
bearish:
0