Price Analysis: Top 3 Coins To Watch From June 14th -KSM, MTL, & RGT. Where Are They Heading?
3
1
Today, we released the top altcoins to watch for the week. These included Kusama (KSM), Metal (MTL), and Rari Governance Token (RGT).
To find out why we picked these projects in a little more detail, look at the article here.
In this analysis, I would like to cover these three coins to help provide some support and resistance you might expect to move forward.
Kusama (KSM) Price Analysis
What has been going on?
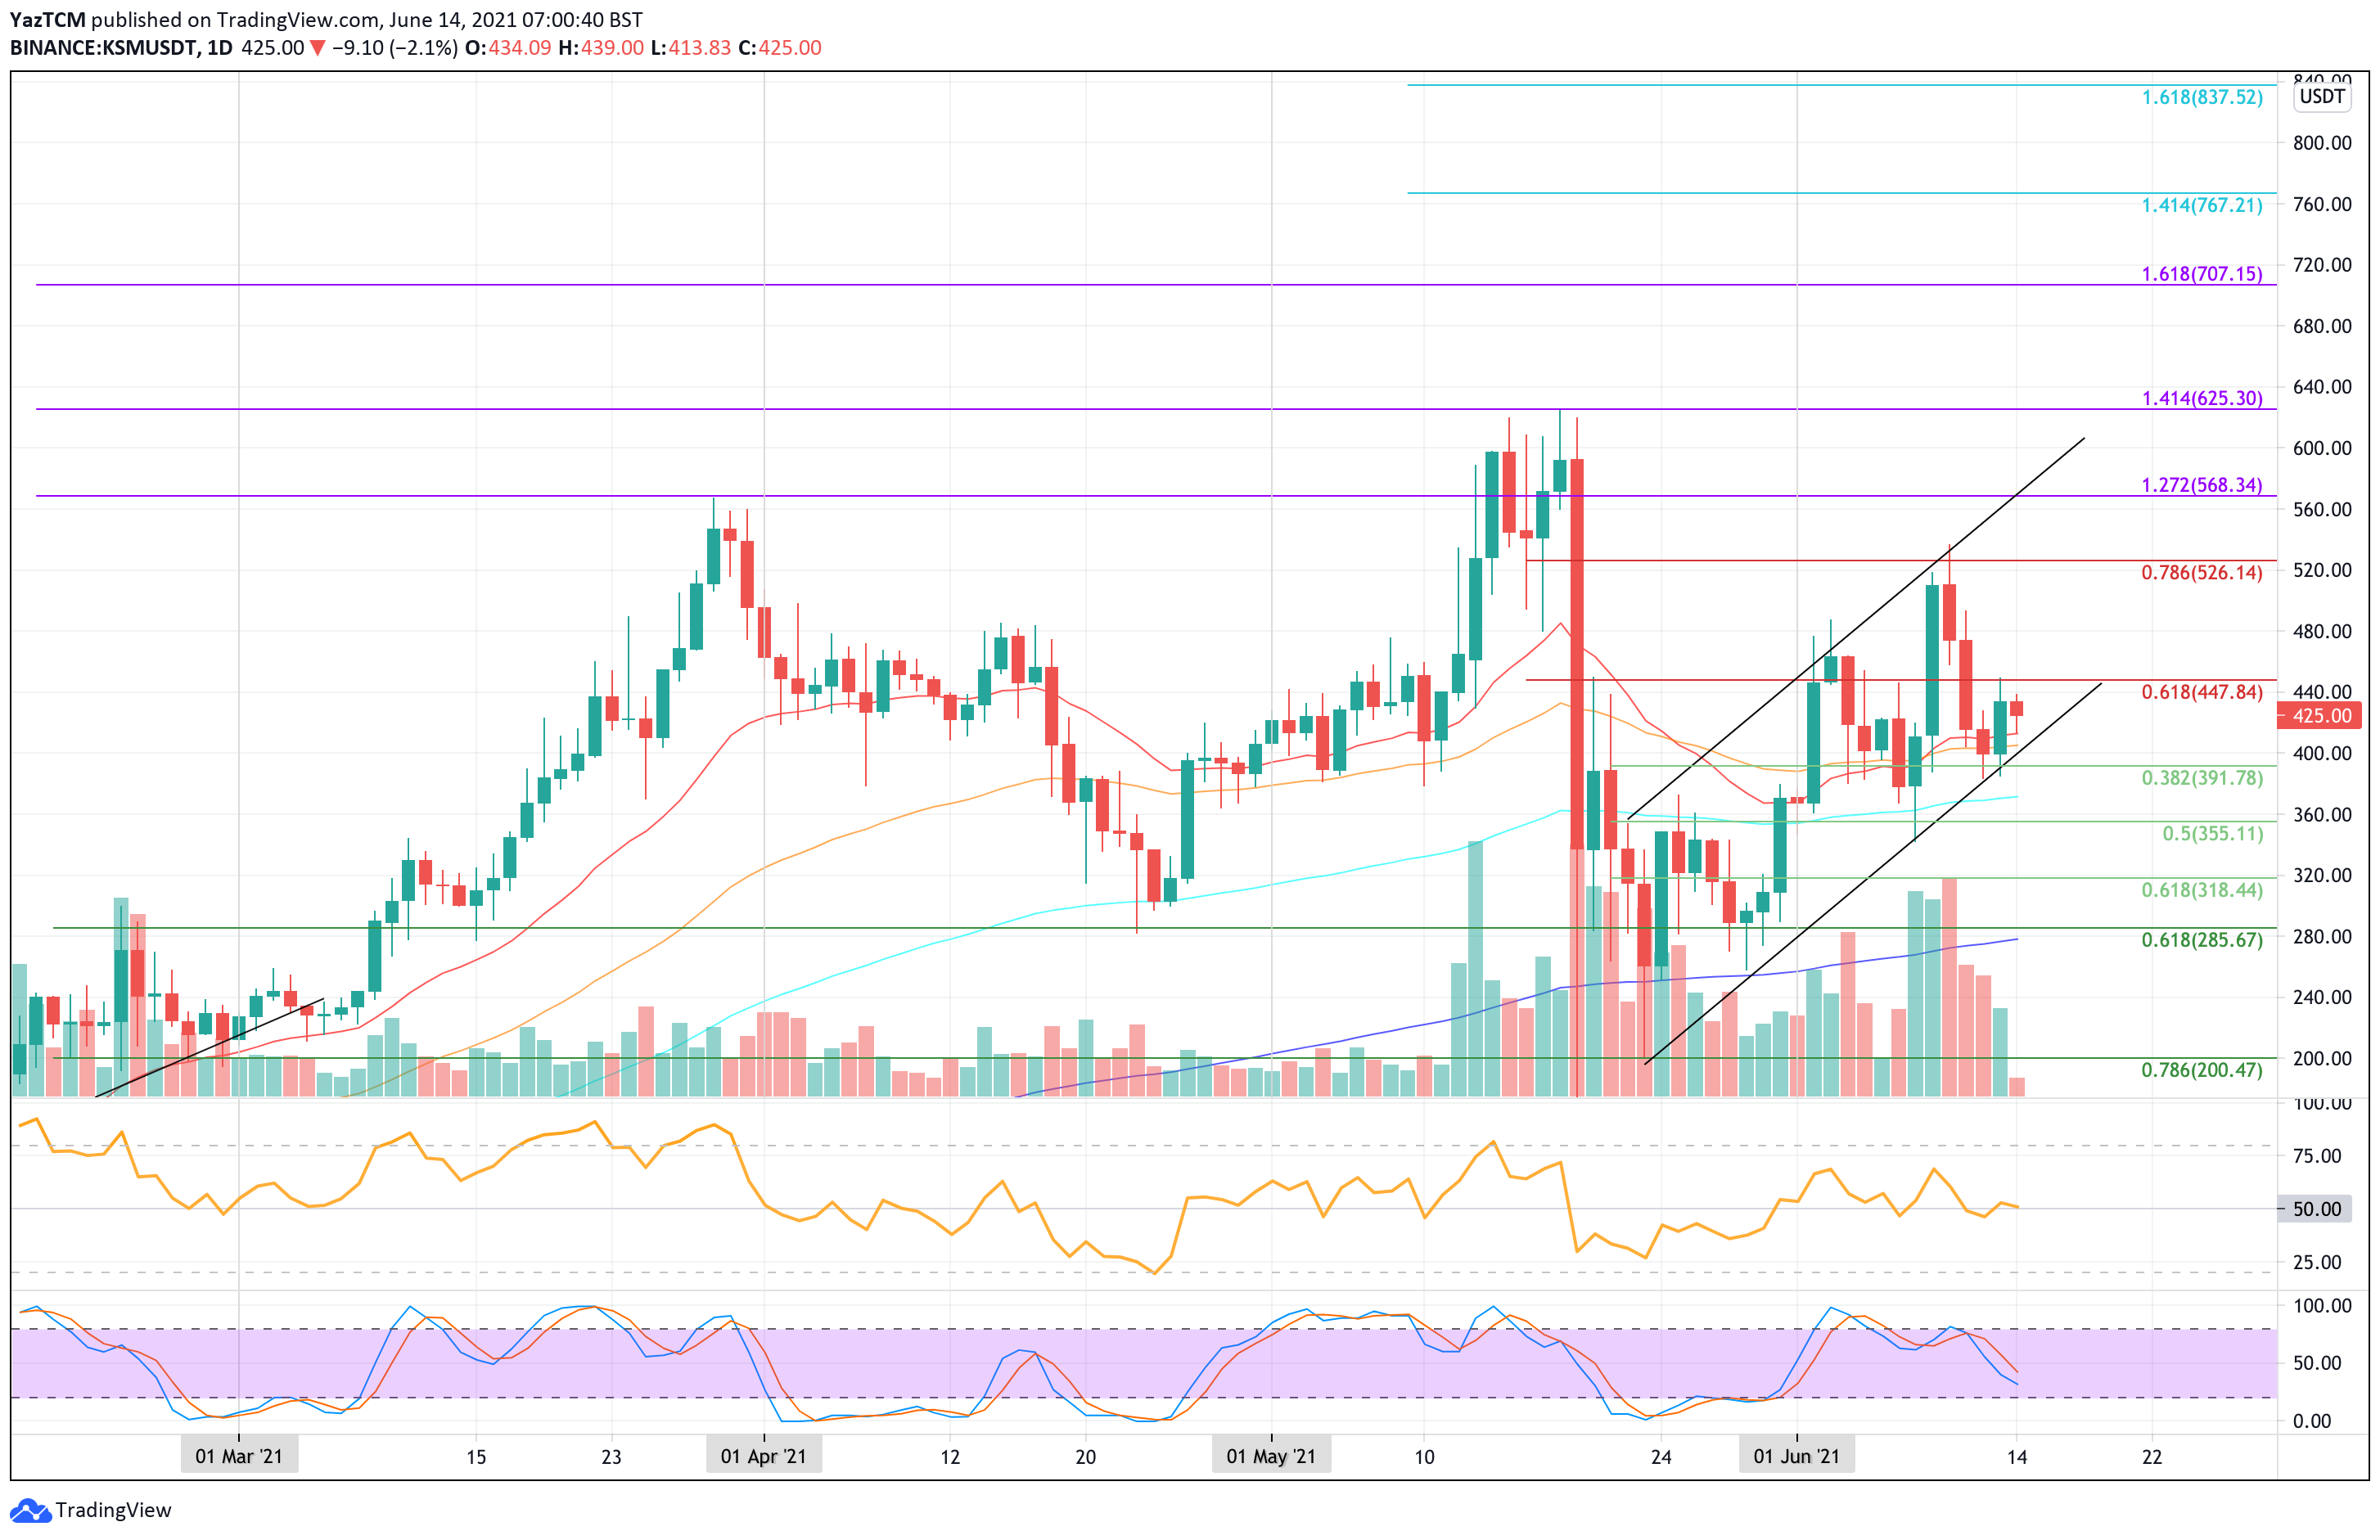
Kusama is up by a strong 8.3% today as the cryptocurrency surges to $425. The cryptocurrency peaked at $625 (1.414 Fib Extension) in May before the market-wide capitulation. During the sell-off, KSM dropped as low as $200, but it quickly rebounded from there and formed an ascending price channel that it is currently trading within.
Last week, KSM bounced higher above $400 and reached as high as $530. There, it met resistance at the upper boundary of the ascending price channel and started to head lower toward the end of the week.
Over the weekend, KSM found support at $400 (lower boundary of the price channel) and has since rebounded higher to the current $425 level.
Kusama is now ranked in the 29th position as it holds a $3.59 billion market cap value.
KSM price short term prediction: Neutral
Despite today’s 8.3% price hike, KSM is still considered neutral until it can close above resistance at $526 (bearish .786 Fib Retracement). On the other side, a drop beneath $285 (200-day MA) would be needed to turn KSM bearish in the short term.
If the sellers push lower, the first level of support lies at $400 (the price channel’s lower boundary and 50-day MA). This is followed by $370 (100-day MA), $355 (.5 Fib), $320 (.618 Fib), $285 (200-day MA), and $240.
Where is the resistance toward the upside?
On the other side, the first resistance lies at $448 (bearish .618 Fib Retracement). This is followed by resistance at $480, $500, and $526 (bearish .786 Fib Retracement). Additional resistance is then expected at $568 (1.272 Fib Extension & upper boundary of price channel), $600, and $625 (1.414 Fib Extension & May highs).
Metal (MTL) Price Analysis
What has been going on?
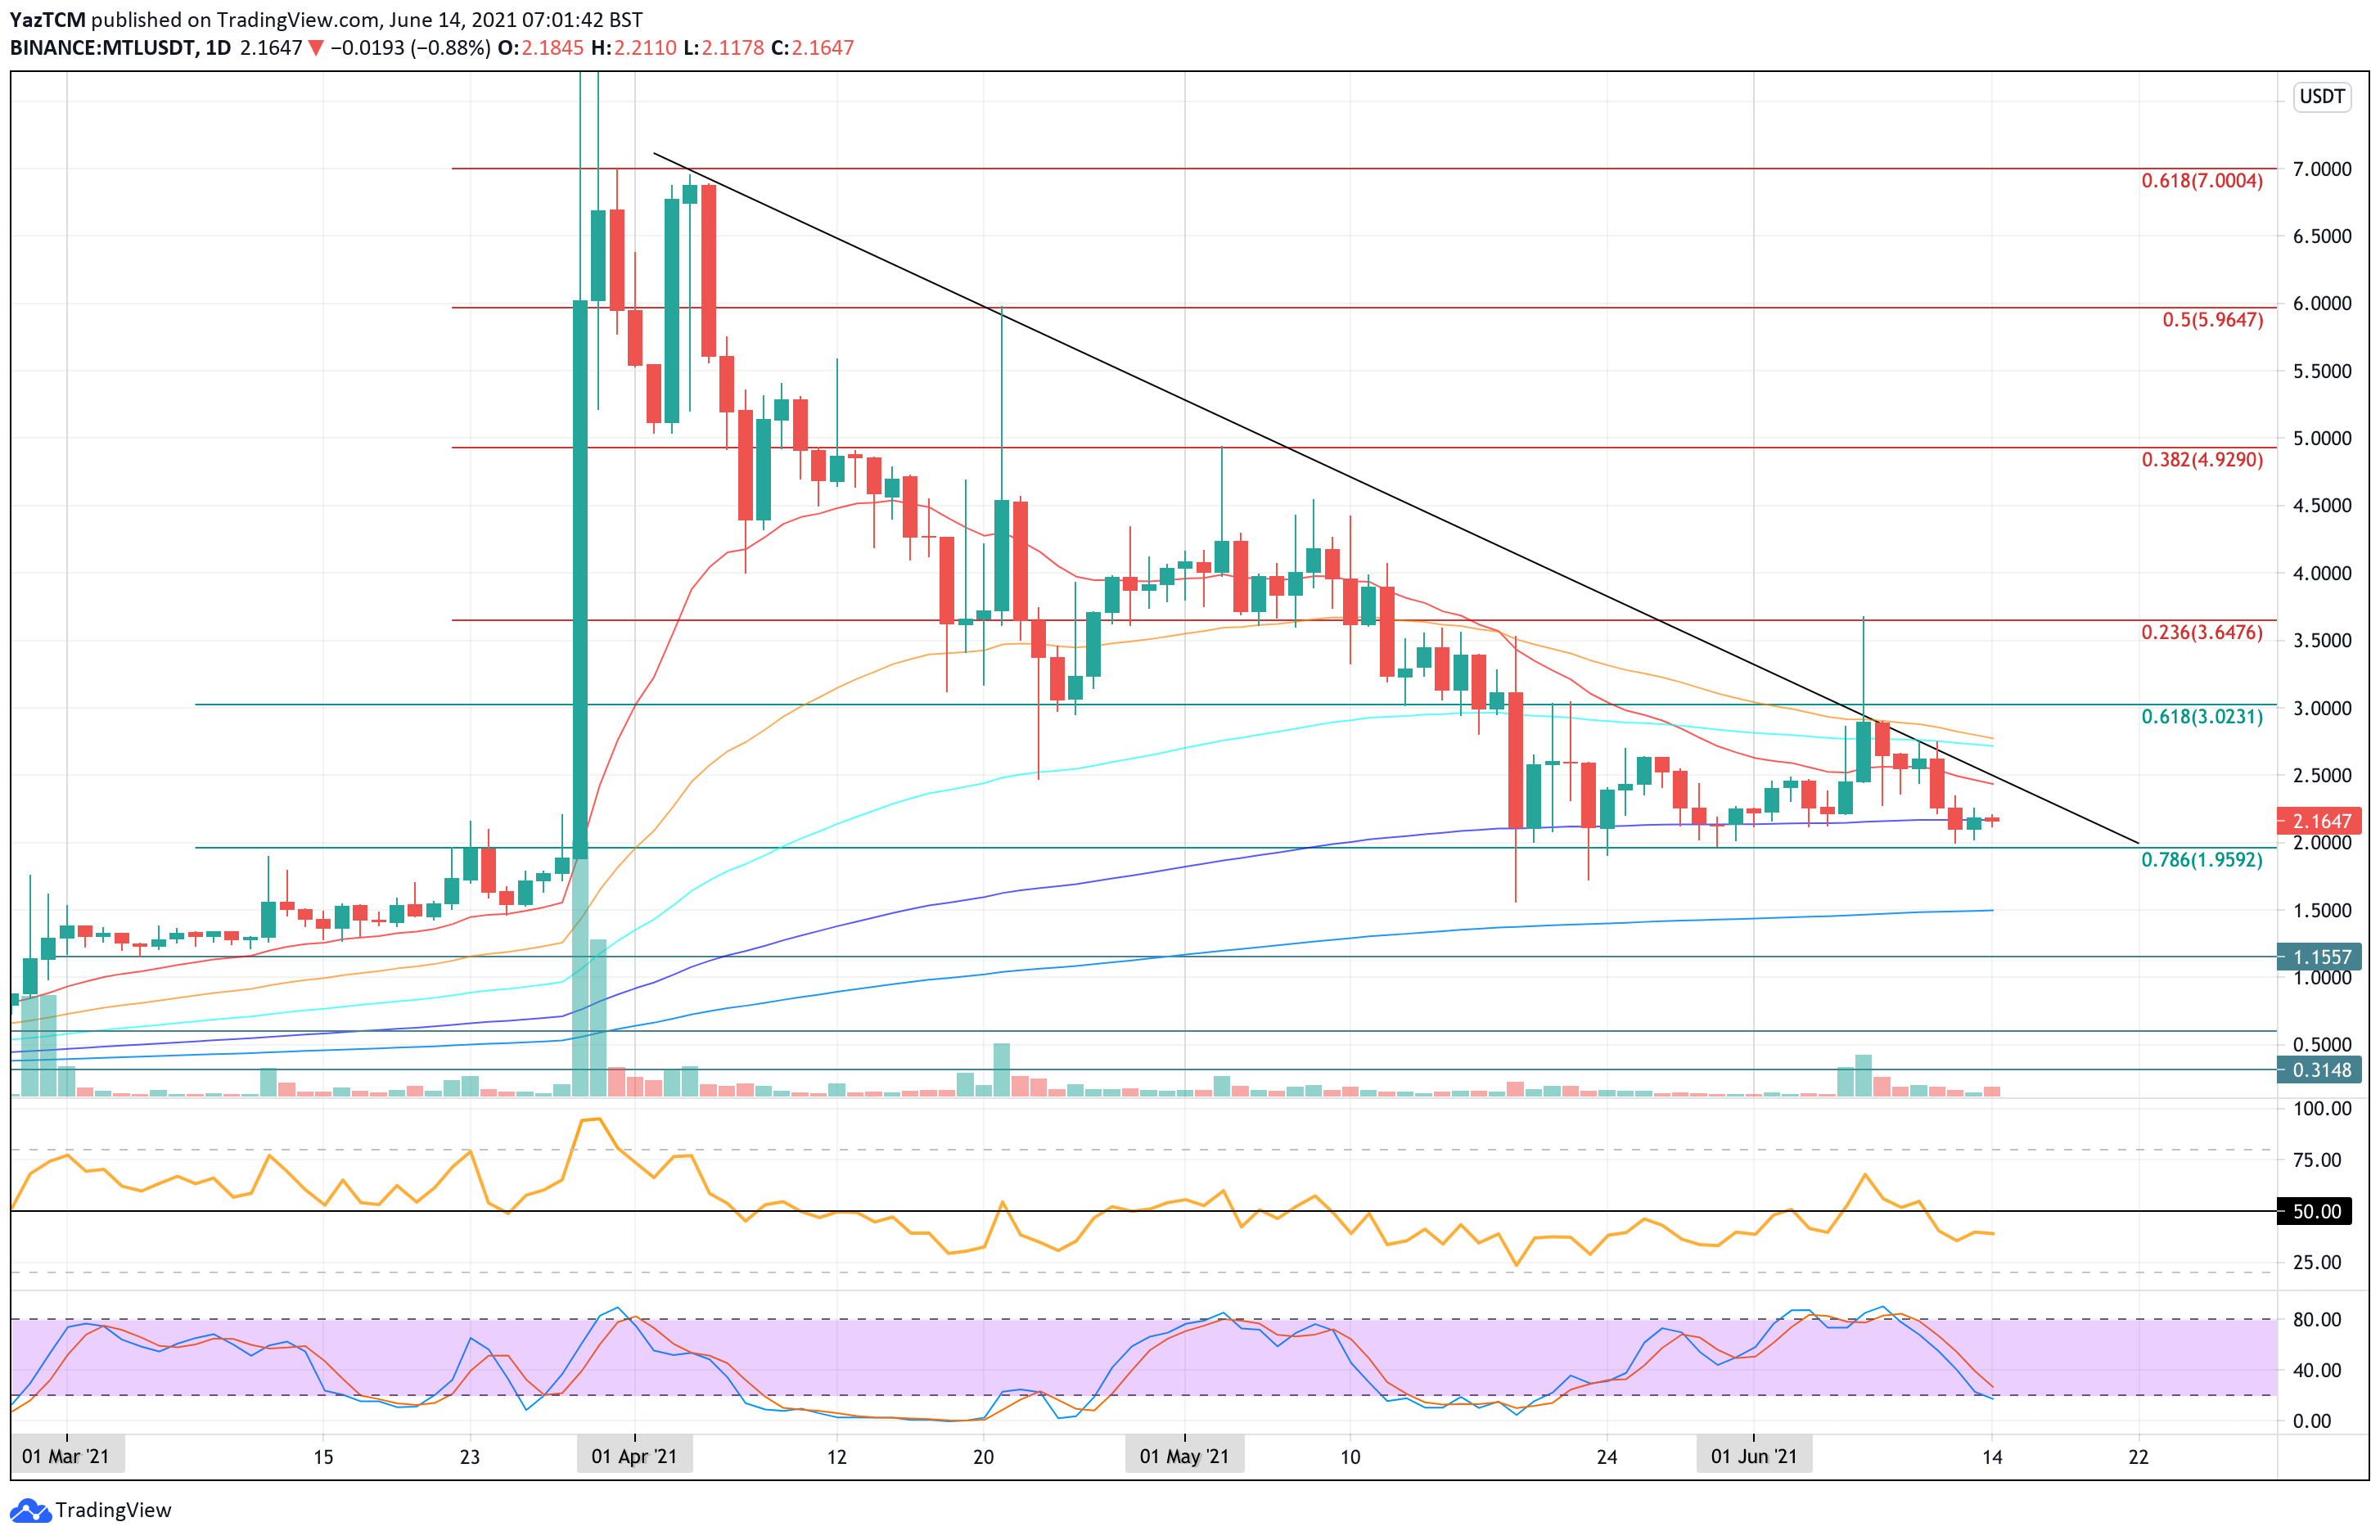
MTL is down by a strong 25% over the past week as the coin currently trades around the $2.16 level. The cryptocurrency has been in a consistent downtrend over the past few months after it set a new ATH price at around $7.00 toward the end of March 2020.
During April, MTL was attempting to hold the support at $3.00, provided by a .618 Fib Retracement level. Unfortunately, the market fell beneath this support during the May capitulation and ended up falling lower until support was found at the 200-day MA level around $2.15.
Since finding the support at the 200-day MA, MTL has been trapped within a narrow range between $2.15 and $3.00. It must break this range to dictate the next direction for the market moving forward.
MTL is now currently ranked in the 215th position as it currently holds a $142 million market cap value.
MTL price short term prediction: Neutral
Metal is considered neutral right now, but a drop beneath the $2.00 level will turn the market bearish. To turn bullish, MTL will have to push higher and break the resistance at the May high at around $4.92 (bearish .382 Fib Retracement).
If the sellers push lower, the first support lies at $2.00 (.786 Fib Retracement). This is followed by support at $1.50 (400-day MA0, $1.15, and $1.00.
Where is the resistance toward the upside?
On the other side, the first resistance lies at the long-term falling trend line. Above the trend line, the first strong resistance lies at $3.00 (the upper boundary of the current range). Beyond $3, resistance is located at $3.65 (bearish .236 Fib Retracement), $4.00, $4.50, $4.92 (bearish .382 Fib Retracement), and $5.00.
Rari Governance Token (RGT) Price Analysis
What has been going on?
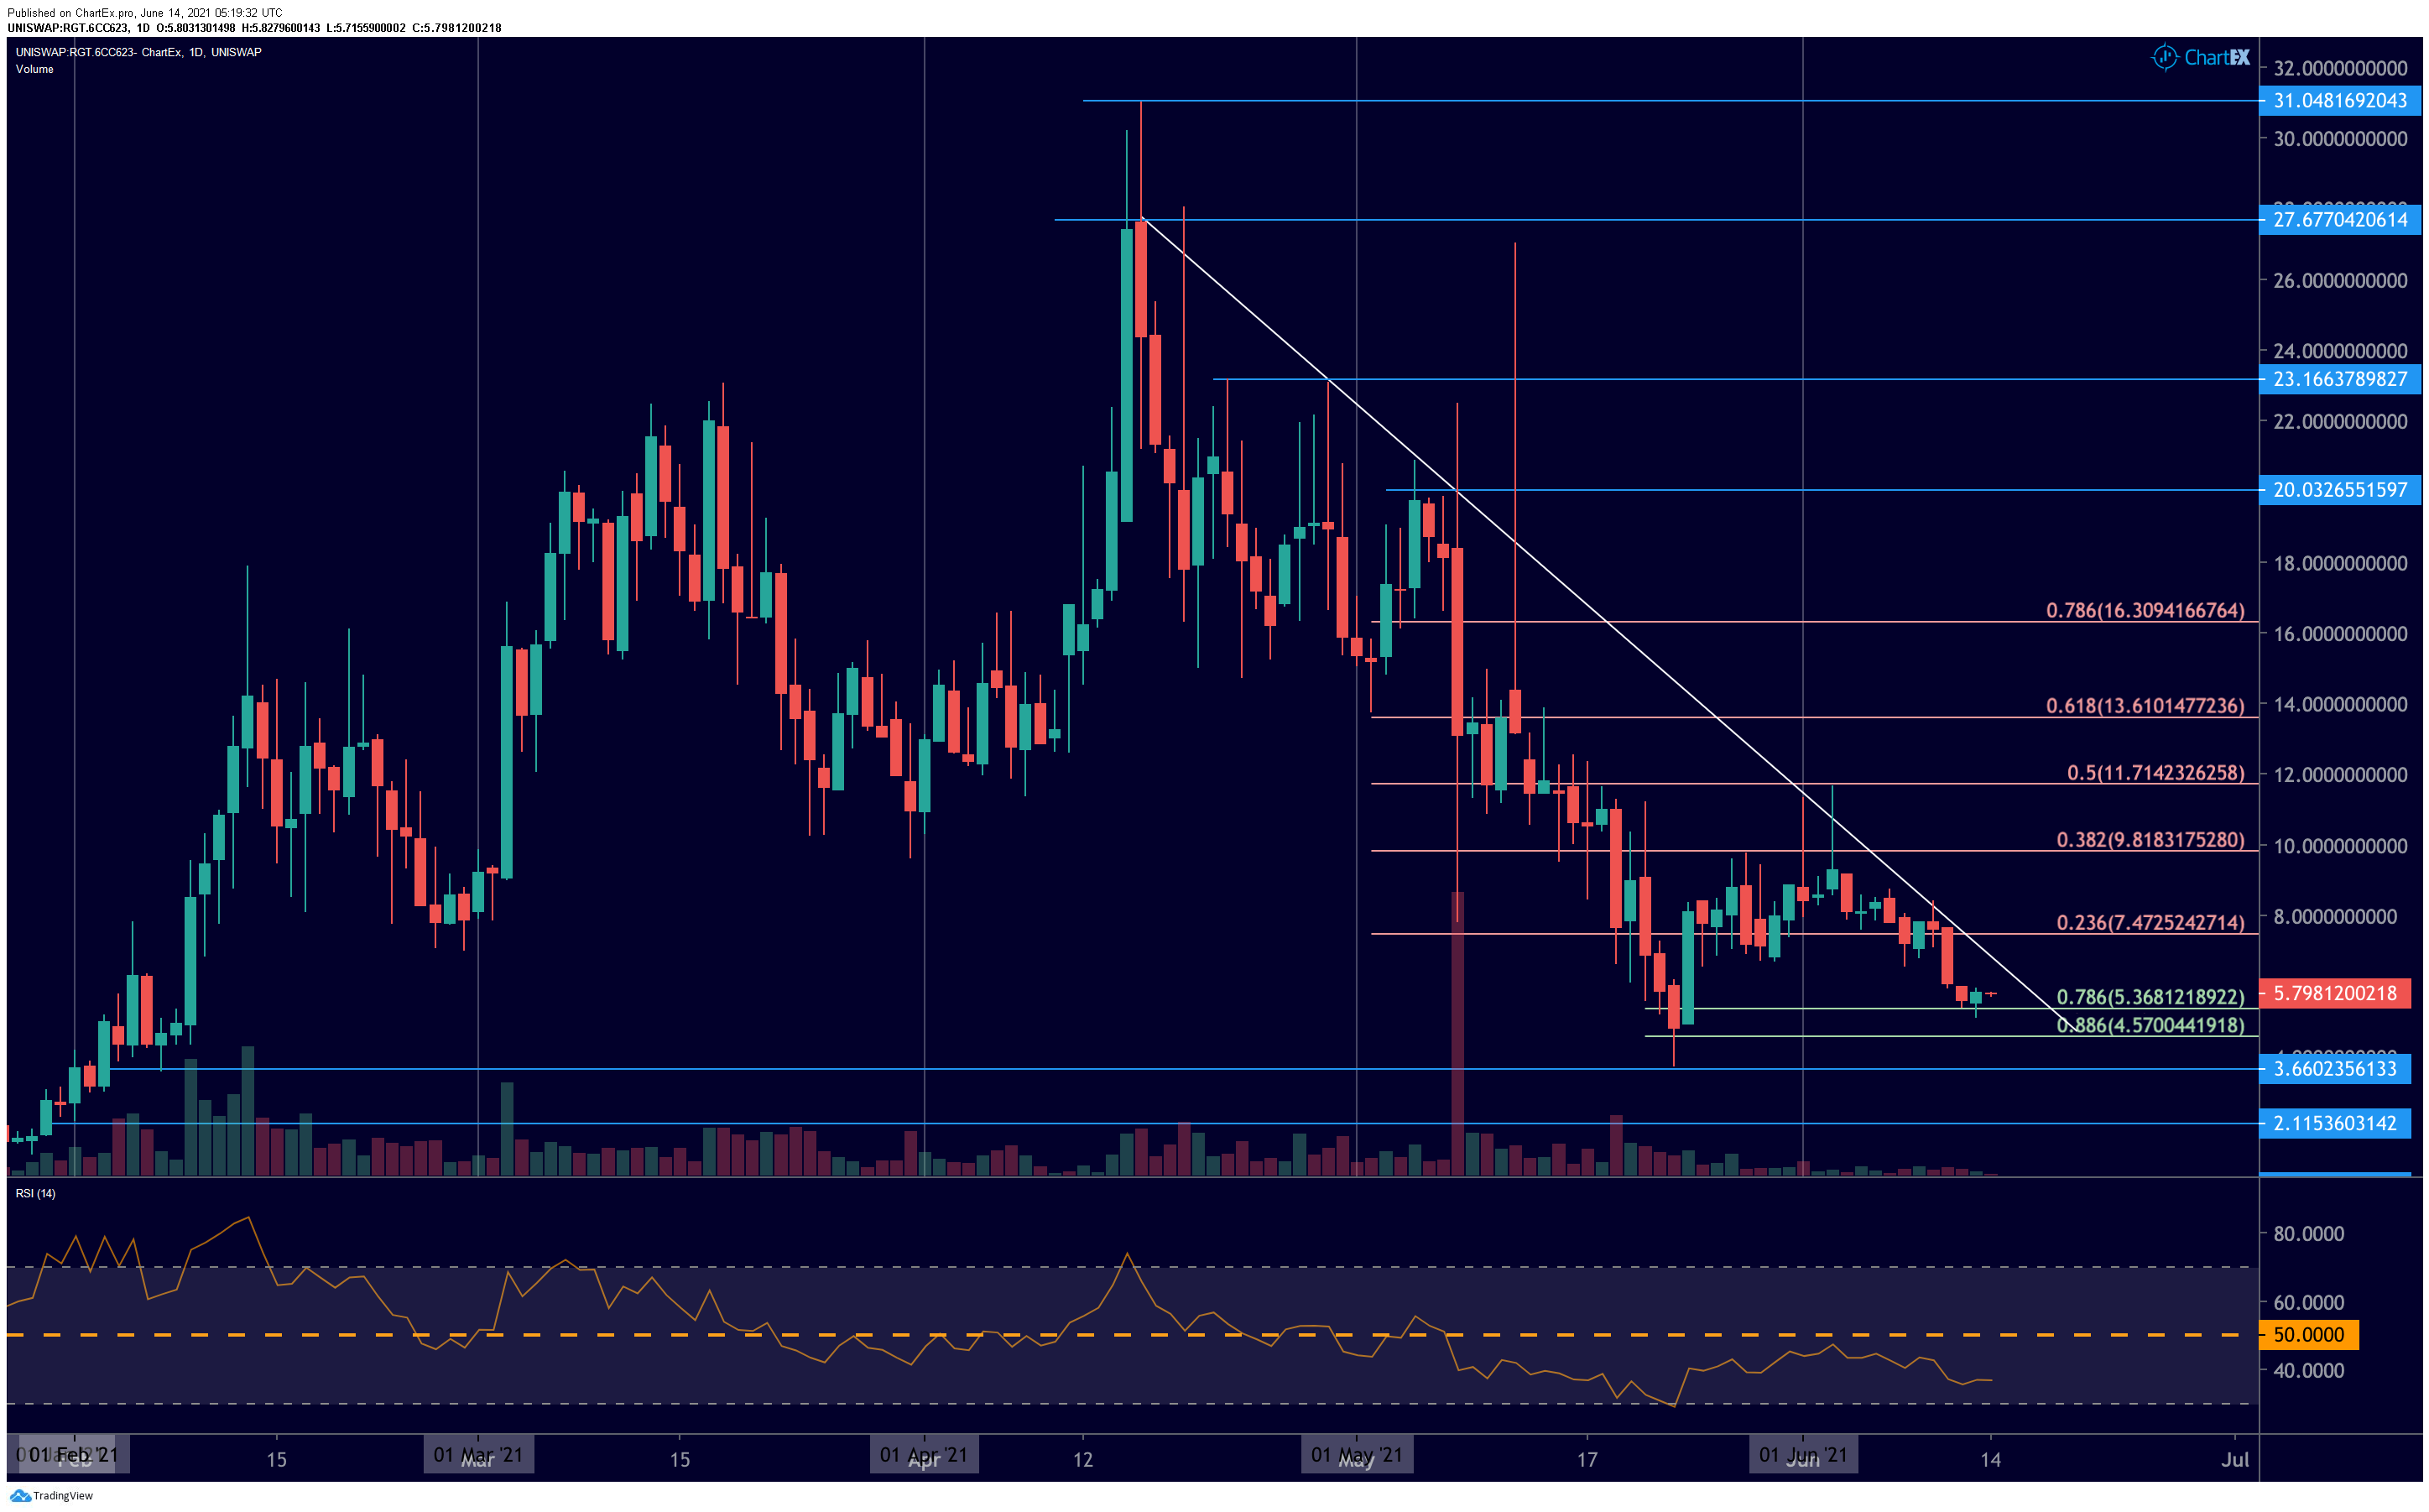
RGT might be up by a solid 10.3% today, but the coin is still down by a sharp 53% over the past month of trading as it currently sits at $5.78. RGT had set an ATH price at $31 earlier in April and has been falling from there ever since. The cryptocurrency fell as low as $3.66 during the May capitulation and rebounded higher from there.
At the start of June, RGT attempted to push higher but could not overcome resistance at $11.71 (bearish .5 Fib Retracement) and stayed beneath the falling trend line.
From there, it headed lower again and recently found support at $5.36 (short-term .786 Fib Retracement) over the weekend.
RGT is now ranked in the 380th position as it currently holds a $52.23 million market cap value.
RGT price short term prediction: Bearish
RGT has to be considered bearish right now and would have to climb above the rising trend line and clear $8 to turn neutral again. It would need to continue above the June highs at $12 to start to turn bullish in the short term.
If the sellers push beneath the support at $5.36, the first level of support beneath lies at $5. This is followed by $4.57 (.886 Fib Retracement), $4.00, and $3.66 (May lows).
Where is the resistance toward the upside?
On the other side, the first levle of resitance lies at $7.4 (bearish .236 Fib Retracement). This is followed by $8, $9.81 (bearish .382 Fib Retracement), $10, and $11.71 (bearish .5 Fib Retracement).
Previous Technical Analysis
At CoinCodex, we regularly publish price analysis articles focused on the top cryptocurrencies. Here's 3 of our most recent technical analysis articles:
- Ethereum Price Analysis - ETH Continues To Straddle 100-day MA as Triangle Apex Draws Closer (Bullish)
- AMP Price Analysis - AMP Surges 90%+ This Week After Coinbase Integration - New ATH Possible? (Bullish)
- Polkadot Price Analysis - DOT Breaks Resistance At Symmetrical Triangle And Surges Toward $20 - New ATH Incoming? (Neutral)
3
1


 すべての暗号通貨、NFT、DeFiを1か所から管理
開始に使用しているポートフォリオを安全に接続します。


