
Master Crypto Profits With Backtest Trading
Backtest trading is what separates calculated traders from gamblers. It's the process of taking a trading idea, winding back the clock, and seeing how it would have actually performed on historical data. In a market as wild as crypto, where a single decision can define your returns, skipping this step is like flying blind.
What Is a Backtesting Strategy
A backtesting strategy is the method of applying a set of strict, objective trading rules to historical market data to see how the strategy would have performed in the past. Think of it as a flight simulator for your crypto portfolio. Before you risk a single dollar, you get to run your strategy through the gauntlet of past market cycles. It's about turning your gut feelings and hunches into a concrete, rules-based system that can be tested and validated.
You define the exact conditions for your buys and sells—maybe it’s a simple moving average cross, an RSI level, or something far more complex—and then let a program simulate those trades against real historical price data. This gives you cold, hard feedback on whether your idea has an edge or if it's just a dud.
Why It Matters in Crypto
Let's be real: the crypto market is a different beast. Strategies that kill it in traditional finance can get absolutely wrecked here. The volatility is extreme, and the market sentiment can flip on a dime.
Backtesting shows you exactly how your strategy would have held up during a brutal bear market, a face-melting bull run, or those long, boring sideways grinds. It prepares you for the reality of trading it.
A backtest reveals the unfiltered truth about a strategy's character. It shows you not just the potential profits, but also the drawdowns and the emotional fortitude required to stick with it during losing streaks.
This is how you build real confidence. When you know your strategy has a proven edge, you're far more likely to follow your own rules for entries, exits, and position sizing, even when the market is pure chaos.
The Core Components of Backtesting
To get started, you really only need three key pieces working in sync. This flow is a great way to visualize it: a strategy gets fed historical data, crunched by an engine, and spits out performance results.
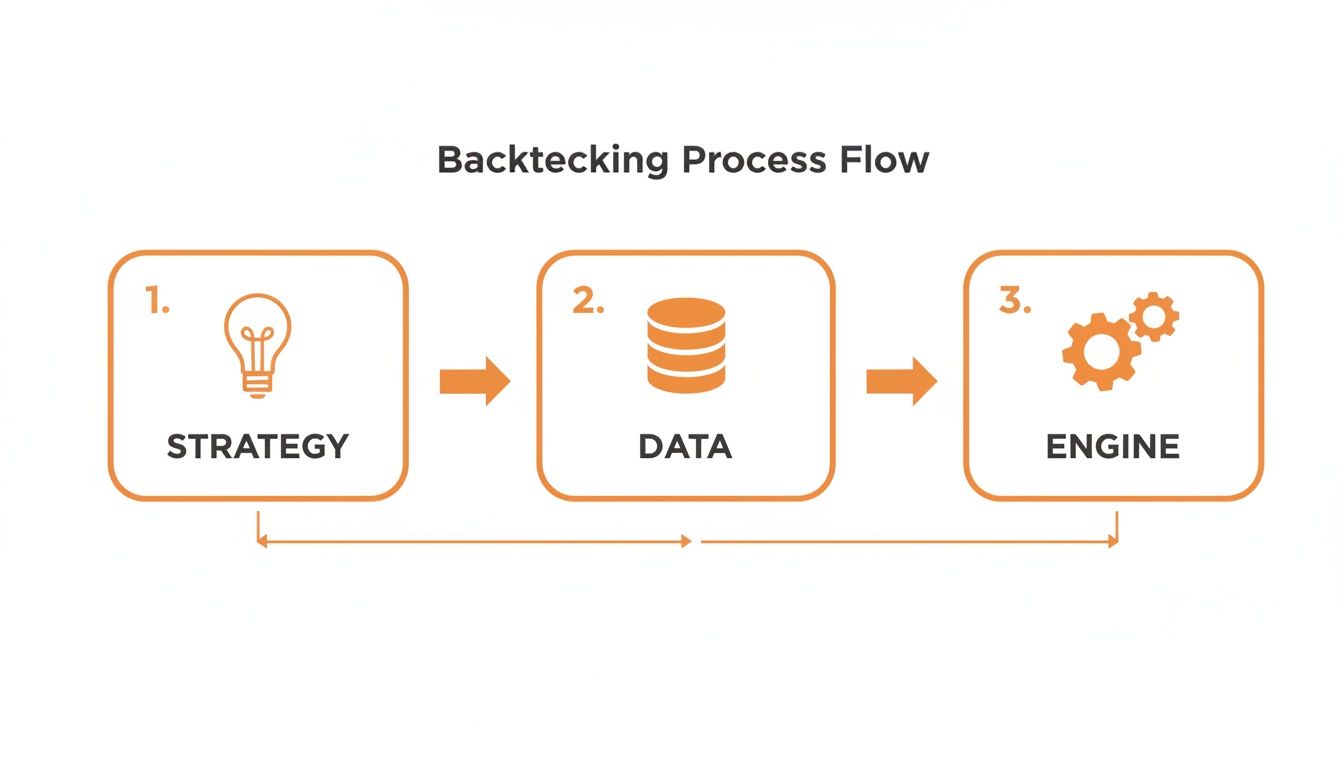
As you can see, a brilliant strategy is useless without clean data, and both are pointless without a solid engine to run the simulation.
To put it plainly, here are the core components you absolutely need to build a backtesting framework.
Core Components of a Backtesting Framework
| Component | Description | Example in Crypto |
|---|---|---|
| A Clear Strategy | Your non-negotiable set of rules for entering and exiting trades. Be specific. | "Buy ETH when its 50-day moving average crosses above its 200-day moving average." |
| Reliable Historical Data | The raw material for your test. It must be accurate price history (OHLCV) covering diverse market conditions. | High-quality, granular price data for BTC/USDT from 2017 to the present. |
| A Backtesting Engine | The software or code that applies your strategy to the data and generates a performance report. | A custom Python script or a platform like CoinStats AI that runs the simulation for you. |
Each of these elements is critical. If one is weak, the entire backtest becomes unreliable, leading you to make bad decisions with real money.
Thankfully, modern tools have made this whole process much easier. For instance, CoinStats now lets you backtest any crypto trading strategy just by describing it in plain English. No code needed. The AI engine handles the heavy lifting and gives you instant performance metrics.
Once you find a strategy you like, you can trade it for real and use the CoinStats Portfolio tracker to see how your live results stack up against your backtested performance. And if you're new to some of these terms, be sure to check out our crypto glossary to get up to speed.
Acquiring and Preparing Your Crypto Data
Let’s be honest. A killer trading strategy is completely useless if you test it on garbage data. Get this part wrong, and you might as well be throwing darts at a board. The quality of your historical data is the absolute bedrock of any backtest that's worth a damn.
First thing's first: you need to decide what kind of data your strategy actually requires. For longer-term swing trades, daily Open-High-Low-Close (OHLC) data can get the job done. But if you're trying to scalp or day trade, you'll need much more granular, minute-level, or even tick-by-tick data to see what’s really going on.
Where to Find Historical Crypto Data
Fortunately, you’ve got options for sourcing crypto data, each with its own quirks.
- Exchange APIs: Most major exchanges like Binance or Coinbase provide free API access to historical prices. This is the go-to for many, but it can be slow and definitely requires some coding chops to pull and format everything correctly.
- Third-Party Data Providers: These are paid services that live and breathe clean, high-quality financial data. They often provide more granular data across a much wider range of assets than any single exchange.
- Direct Blockchain Access: For the most hardcore data collection, you can look into solutions that let you deploy blockchain nodes directly. This gives you raw, unfiltered access to both historical and real-time transaction data.
Of course, there's a simpler way. A dedicated crypto API built for this purpose cuts out a lot of the headache. For example, you can find extensive documentation for pulling historical prices using the CoinStats API, which makes fetching data across thousands of coins and multiple exchanges a whole lot easier.
The Importance of Data Granularity
The level of detail in your data—its granularity—can make or break your backtest. Daily data is fine for spotting big-picture trends, but it completely misses the intraday chaos where short-term strategies live or die. It smooths over the real peaks and valleys, hiding the true risk your strategy would have faced.
Historical tick data, on the other hand, is a game-changer for high-frequency and intraday crypto strategies. Some providers offer over 25 years of tick-by-tick records, allowing for hyper-realistic simulations that account for spreads, slippage, and order book dynamics. In one case, an AI-powered backtest crunched 21 years of daily S&P 500 data in seconds, spitting out a 68.87% win rate and showing what's possible when you combine speed with deep data. For day traders, this means you can test ideas on Bitcoin tick data and factor in entries and exits down to the millisecond.
Key Takeaway: Your data's quality dictates your backtest's reliability. Garbage in, garbage out. Make sure your dataset is clean, accurate, and covers a long enough period to include bull, bear, and sideways markets.
Cleaning and Preparing Your Dataset
Once you’ve got your hands on the raw data, the work isn't over. Not even close. You need to scrub it clean to ensure it's accurate and ready for testing. This is the most critical—and most often skipped—step of the whole process.
Common Data Issues to Fix:
- Missing Data: Gaps in your price history can completely wreck your results. You need a plan to either fill the gaps with estimated values (interpolation) or just remove that period from your test entirely.
- Incorrect Values: Keep an eye out for obvious glitches, like a price of $0 or a sudden, impossible wick to the moon. These are just noise and should be corrected or flat-out removed.
- Survivorship Bias: This one is sneaky. It happens when your dataset only includes coins that "survived" and conveniently leaves out all the ones that went to zero. A backtest on this kind of data will look amazing, but it’s a fantasy because it ignores all the potential losers.
- Timezone and Timestamp Alignment: This is non-negotiable. Make sure all your data is standardized to a single timezone (UTC is the standard) to avoid ugly timing errors in your trade signals.
Taking the time to meticulously clean your dataset is what separates a professional from an amateur. This prep work ensures that when you finally run your backtest, the results you see are from your strategy—not from a bunch of noise in your data.
Building the Brains of Your Strategy
Alright, you’ve got clean data. Now for the fun part: turning your trading ideas into a concrete set of rules a machine can actually test. This is where your concepts get real, fast. A solid backtest trading process lives or dies on having an explicit, non-negotiable logic for every single action.
You need to define the exact "if-then" conditions for your entries, exits, stop-losses, and take-profit targets. A vague feeling like "buy low, sell high" isn't a strategy—it's a wish.
A real strategy sounds more like this: "Buy Bitcoin when its price closes above the 20-day Simple Moving Average (SMA) and its 14-day Relative Strength Index (RSI) is below 30. Sell when the price closes below the 20-day SMA or the RSI climbs above 70."
See the difference? This level of detail is non-negotiable. It leaves zero room for guesswork, which is exactly what a backtesting engine needs to do its job.
Common Strategy Frameworks
While strategies can get wild, most are built on a few core concepts. Understanding these will give you a solid foundation to build from.
- Trend Following: The goal here is simple: ride the wave. A classic example is the moving average crossover. When a short-term moving average (like the 50-day) punches above a long-term one (the 200-day), it signals a potential uptrend—a "golden cross"—and triggers a buy. The reverse, a "death cross," signals it's time to sell.
- Mean Reversion: This is all about betting that prices snap back to their historical average. Traders often use Bollinger Bands for this, buying when the price hits the lower band (it’s likely oversold) and selling when it touches the upper band (overbought).
- Breakout Trading: This involves jumping into a position when the price smashes through a known support or resistance level, especially with a spike in volume. The bet is that the momentum will carry it further in the breakout direction.
Many of the most effective strategies also try to look into the future. Getting a handle on various time series forecasting methods can seriously upgrade your logic by helping you build more predictive models from past price action.
Skip the Code with CoinStats AI
In the old days, testing these rules meant you had to be a coder. You’d spend hours writing Python scripts to pull data, crunch the numbers, and simulate trades. It was a massive barrier that left a lot of great ideas on the drawing board.
Thankfully, those days are over. Modern tools have completely changed the game, and https://coinstats.app/ai CoinStats AI is leading the charge by allowing you to backtest any complicated crypto trading strategy with AI.
Key Insight: You no longer need to be a programmer to run a professional-grade backtest. With the right platform, you can test complex ideas in seconds using plain English and focus your energy on strategy, not code.
CoinStats AI is a perfect example of this shift. It’s a powerful tool that lets you describe even complicated crypto strategies in natural language and then runs the simulation instantly.
The screenshot says it all. You just type out your entry and exit conditions, and the AI handles all the heavy lifting in the background, giving you immediate feedback on whether your idea has legs.
Instead of wrestling with code, you can just tell CoinStats AI:
Buy 10 ETH when the 12-period EMA crosses above the 26-period EMA. Sell when it crosses below.
The AI will immediately run that strategy against historical data and spit out a full performance report—total profit, win rate, drawdown, you name it. This speed creates a powerful feedback loop. If a strategy flops, you can tweak a parameter or change a rule and get new results in seconds. It’s all about rapid iteration until you find something with a real edge.
Once you land on a promising backtest, you can see how it performs in the real world using the CoinStats Portfolio tracker. This lets you check if your live results are matching your simulated expectations—the final step in knowing if you've truly found a winner.
How to Analyze Your Backtest Performance Metrics
Alright, your backtesting engine just spat out a report. It’s easy to get tunnel vision and focus only on that big, shiny profit number at the top. But let’s be real—total return is just one piece of the puzzle. A truly solid strategy is defined by its entire performance profile, not just one flashy number.
This is where you separate the disciplined traders from those just chasing fool's gold. The goal is to get a complete picture of your strategy's personality. A strategy that doubles your money but puts you through a gut-wrenching 70% drawdown isn't a strategy you'll stick with when real money is on the line. Trust me. Analyzing these metrics is how you find a strategy that actually fits your risk tolerance.
Key Metrics to Master
When you open that backtest report, your eyes should immediately dart to a few core stats. They tell the real story of your strategy's risk, reward, and consistency.
- Total Profit/Loss (P&L): This is the bottom line, the net profit or loss. It’s important, but it’s almost meaningless without the context that follows.
- Win/Loss Ratio: Simple but crucial. It’s the ratio of your winning trades to your losing ones. Anything above 1.0 means you’re winning more often than you're losing.
- Average Win and Average Loss: These two numbers tell you if your wins are big enough to cover your losses. You can have a profitable strategy with a terrible win rate, as long as your average win dwarfs your average loss.
These give you a quick first impression, but the real nuggets of wisdom are buried in the risk-adjusted numbers.
Understanding Risk-Adjusted Returns
Profit is great, but how much risk did you have to take to get it? This is the single most important question in backtest trading analysis.
Your go-to metric here is the Sharpe Ratio. It measures your return per unit of risk, telling you if your profits came from smart decisions or just from taking on a ridiculous amount of risk. Generally, a Sharpe Ratio above 1.0 is considered pretty good.
The other metric that can make or break a strategy is Maximum Drawdown (Max DD). This is the biggest drop your portfolio took from a peak to a trough. It’s a direct measure of the financial—and emotional—pain you would have endured.
A high maximum drawdown is a huge red flag. If you can't mentally stomach watching your portfolio tank by that much, you'll abandon the strategy at the worst possible time.
From Simulation to Reality
Even with simple strategies, proper testing can be incredibly revealing. For example, a classic moving average crossover strategy tested on major market indices has proven its worth time and again. One study showed a strategy that bought when a short-term average crossed a long-term one delivered a compound annual growth rate (CAGR) of 8.5%.
More importantly, it did so with a manageable maximum drawdown of just 15%. With a win/loss ratio of 1.8, it consistently outperformed a simple buy-and-hold approach. This is exactly what a good backtest should do: uncover strategies with a superior risk-reward profile.
This is where it all comes together. Once you’ve identified a promising strategy, the next move is to see how it fares with a small amount of real capital. This creates a powerful feedback loop. You can use the P&L analytics inside the CoinStats Portfolio tracker to track your live performance and compare it directly against your backtested results. This constant comparison is what helps you validate your findings and make smart adjustments over time.
For a deeper dive into the numbers that truly matter, check out our guide on cryptocurrency portfolio analysis, which breaks down many of the same metrics you'll be staring at in both your backtests and your live portfolio.
Avoiding Common Pitfalls to Validate Your Results
A profitable backtest feels great. That rush of confidence when you see a strategy crushing historical data is a powerful thing. But it can also be dangerously misleading.
A great-looking result can easily be a statistical illusion, tempting you to risk real money on a broken strategy. This is the final step before you even think about going live—where you actively try to break your own system. If it survives, you might actually have something.
Overfitting: The Most Dangerous Trap
Overfitting is the cardinal sin of backtesting. It's what happens when you tweak your strategy so perfectly to past data that it just "memorizes" history instead of learning a real market pattern. The result? A strategy that looks like a world-beater in your test but completely falls apart in the live market.
Imagine you built a strategy that worked flawlessly during the 2021 crypto bull run. Buying every single dip probably would have looked genius. But that same strategy would get absolutely demolished in the sideways chop or bear market that followed.
A backtest is a hypothesis, not a guarantee. The goal of validation is to gather as much evidence as possible to prove that your hypothesis is sound and not just a product of random chance or data-fitting.
To avoid this, you have to test your strategy on data it has never seen before. This is called out-of-sample testing. The process is simple: split your historical data into two buckets.
- In-Sample Data: The data you use to build and fine-tune your strategy.
- Out-of-Sample Data: A separate, untouched period you use to see if the strategy still works.
If your strategy performs well on both datasets, that’s a very strong sign you’ve found a robust edge and not just a fluke.
Guarding Against Look-Ahead Bias
Look-ahead bias is a much sneakier trap that can completely invalidate your results. It happens when your simulation accidentally uses information that wouldn't have been available at the moment of a trade. A classic example is using a candle's closing price to decide to buy at the open of that same candle.
A more subtle version is survivorship bias. This happens if your dataset only includes coins that are still trading today, conveniently ignoring all the ones that went to zero. Your backtest looks amazing because it only traded the "survivors," when in reality, your strategy might have piled into several failed projects.
Always be ruthless in checking that your code only uses information that was available before a trade decision was made. Every data point has to reflect what a real trader would have known at that exact moment.
Incorporating Realistic Costs
Your backtest isn't happening in a fantasy land. In the real world, every single trade costs you money. If you don't account for these costs, your performance report is pure fiction.
Make sure you're factoring in the real-world friction:
- Trading Fees: Every buy and sell order comes with a fee. Even a small 0.1% fee can be a killer for high-frequency strategies, eating away at your profits trade by trade.
- Slippage: This is the gap between the price you expected and the price you actually got. In volatile or illiquid markets, slippage can be a major profit drain. It's smart to assume a realistic slippage cost, like 0.05% – 0.1%, for every trade.
Adding these costs gives you a much more sober and accurate picture of your strategy's true potential. A strategy that’s barely profitable before costs will almost certainly be a loser after them.
Comparing Backtest to Live Performance
Once a strategy has passed all your stress tests, the final exam is deploying it with a small amount of capital. This is where the rubber meets the road.
This is also where you need a clear, no-BS view of your live profit and loss, like the one provided by the CoinStats Portfolio tracker.
This dashboard lets you see your actual performance, which you can then hold up against your backtested results. Are they lining up? Or are they wildly different? A major deviation is a red flag that your backtest missed something critical, like real-world liquidity issues or higher-than-expected slippage.
Using a tool like the CoinStats Portfolio tracker is crucial for closing this loop between simulation and reality.
FAQ
Diving into backtest trading can feel like opening a can of worms. A lot of questions pop up. Here are the straight answers to the ones we hear all the time.
What Is Backtesting Strategy?
A backtesting strategy is your trading plan, but with strict, non-negotiable rules tested against historical data. No more trading on "a feeling." You define the exact conditions for every single trade.
For example, a classic strategy is the "Golden Cross": Buy Bitcoin when its 50-day moving average crosses above the 200-day moving average, and sell when the opposite happens. By running these rules against past market data, you get to see how it would've played out. This gives you hard data on its potential profitability and risk before a single dollar is on the line.
How Much Data Do I Really Need for a Good Backtest?
This one’s simple: it completely depends on how often you trade.
- Day traders and scalpers: You'll need months of minute-level, or even tick-by-tick, data. You have to capture all that intraday chaos.
- Swing or position traders: At a minimum, you want 3-5 years of daily data.
The golden rule? Your data has to cover multiple market cycles. A strategy that only works in a screaming bull market is a ticking time bomb. You need to see how it holds up in a bull run, a nasty bear market, and those long, boring sideways periods. Only then can you call it robust.
A killer backtest is a great start, but it's not a crystal ball. Things like slippage, trading fees, and surprise market nukes will change the outcome. What you're doing is stacking the probabilities in your favor.
Can I Backtest a Strategy if I Can't Code?
Absolutely. The days of needing to be a Python wizard to backtest are over. While coding gives you ultimate flexibility, modern tools have opened this up for everyone.
Platforms like CoinStats AI were built for this. You can literally just describe your strategy in plain English. For example, you could type, "Buy Ethereum when RSI is below 30 and sell when it's above 70." The AI does the heavy lifting, runs the numbers, and spits out a full performance report. Instantly.
What’s the Difference Between Backtesting and Paper Trading?
Think of it as a two-step verification process for your strategy. They aren't the same thing, and one doesn't replace the other.
- Backtesting: This is your historical simulation. You're using past data to see how a strategy would have performed. It's fast, letting you test ideas across years of market history in minutes.
- Paper Trading: This is your forward test. You're simulating your strategy in the live market with fake money. It’s the final dress rehearsal before you go live, confirming if the strategy actually works with current liquidity and volatility.
After a successful backtest, paper trading is the logical next move. It's your reality check. Once a strategy proves itself in both, you can use a tool like the CoinStats Portfolio tracker to monitor its real performance and make sure it’s actually delivering the results you expected.
Ready to stop guessing and start testing? With CoinStats AI, you can backtest any crypto trading idea using simple English and see the results in seconds. Discover your edge with CoinStats AI today.