Bubblemaps Integration, Portfolio Value Alerts, AI-Powered Int. & More
Gm to all! It’s been a minute since our last roundup, and we’ve been heads down shipping. We’ve rolled out some new, exciting features to make tracking your portfolio even easier. Let’s get into it.
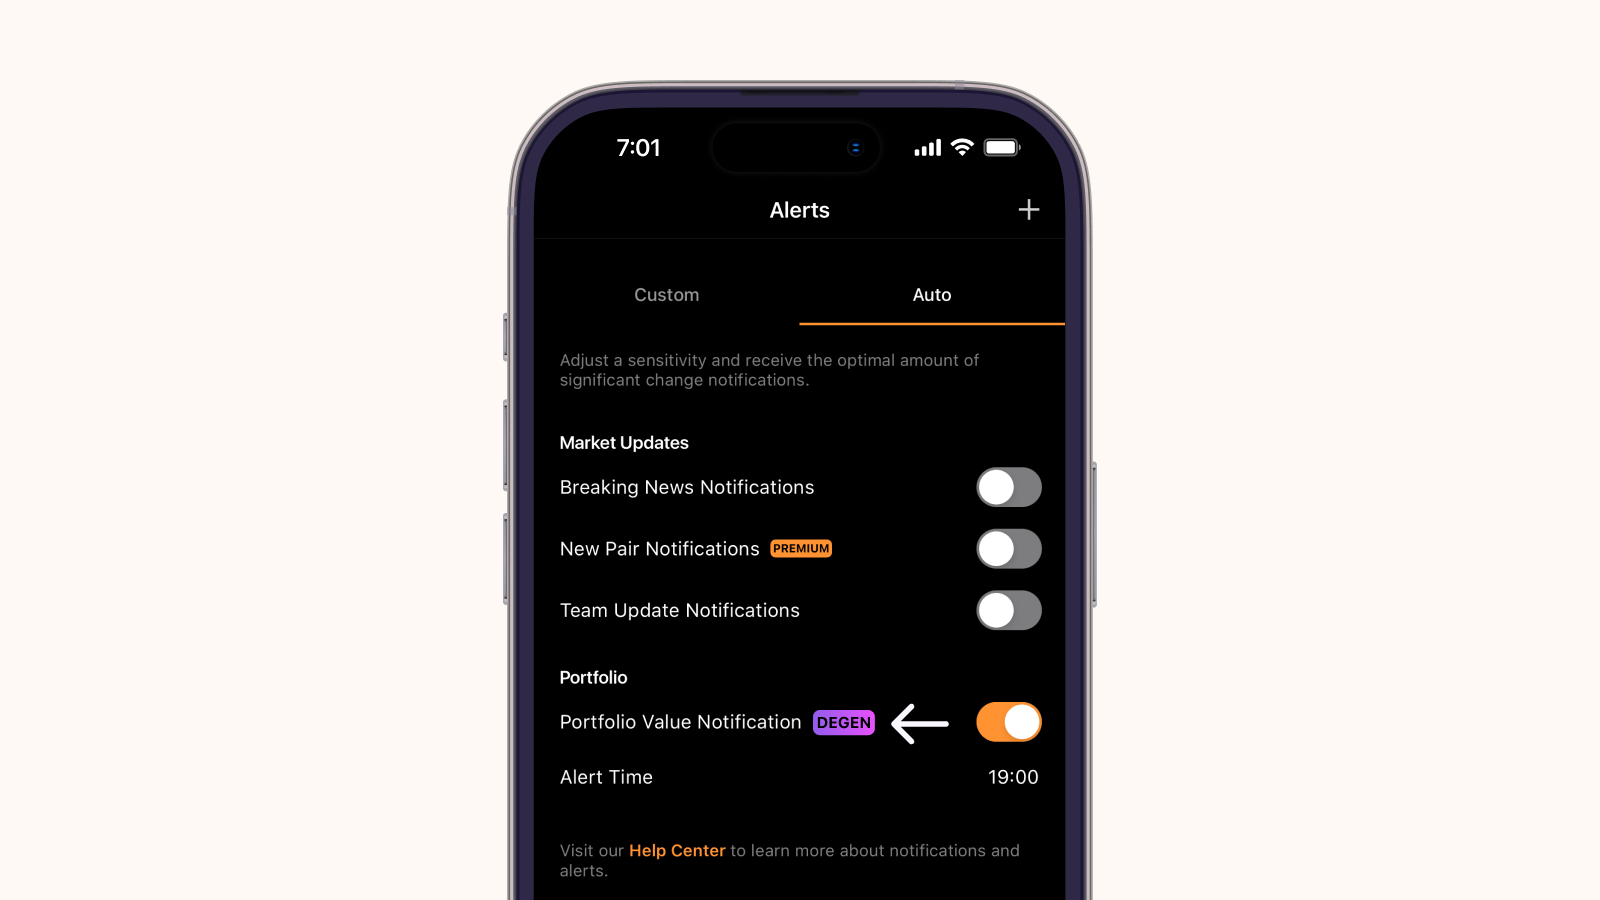
Portfolio Value Custom Alerts
On top of price, volume, and market cap alerts, you can now set notifications based on your total portfolio value. Hit a milestone? Get pinged. Drop below a threshold? Know instantly. Set a target value or a percentage move (up or down), and we’ll send the alert straight to your phone.
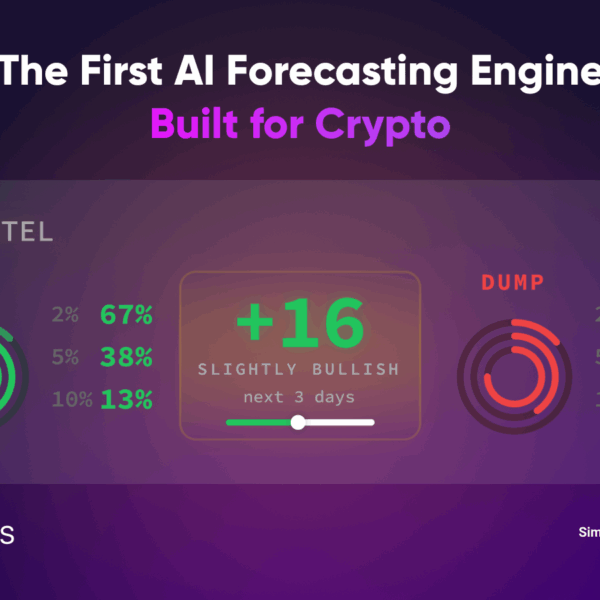
Hyperextropy, the AI-powered Market Intelligence
We’ve recently partnered with Duon Labs to bring you Hyperextropy, an AI-driven market intelligence tool that delivers insights on 30 leading crypto assets right to your fingertips. You can read our in-depth product update blog for the full breakdown. This is only the beginning; expect to see more AI-powered intelligence on CoinStats in the foreseeable future.

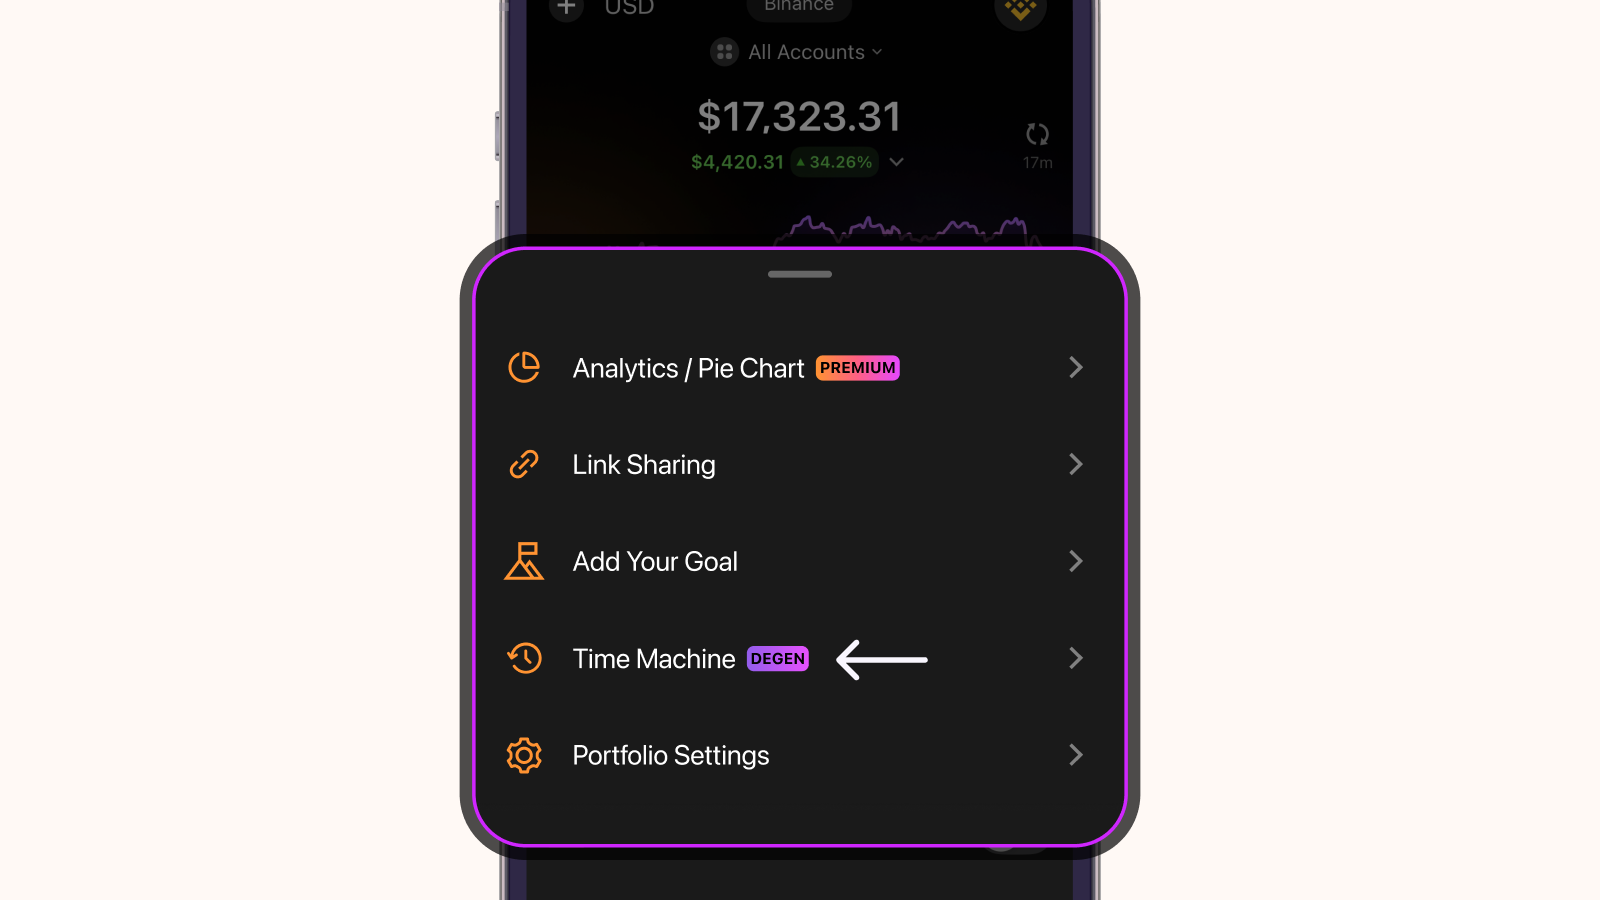
Time Machine Transaction-based Data
Want to jump back in time and see the transactions you made three months ago or even a year ago? Now you can, even for activities before you subscribed to CoinStats Degen plan. This level of historical visibility isn’t available on most centralized exchanges. Just open your portfolio, select a date, and instantly revisit your history.
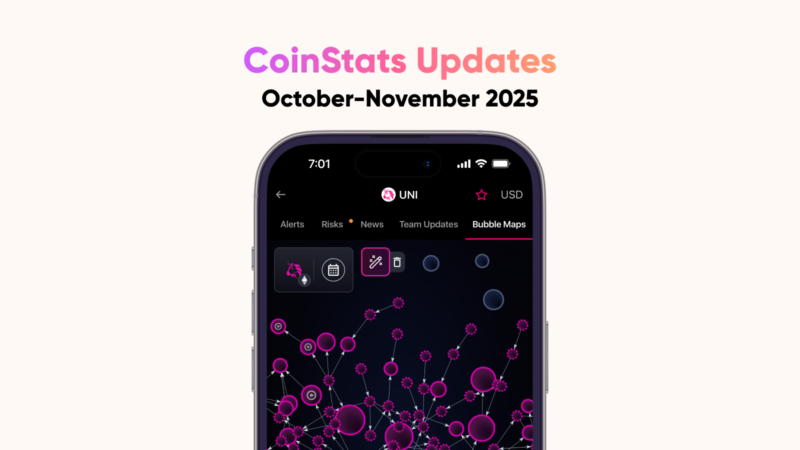
Bubblemaps Integration
We’ve integrated Bubblemaps directly into the CoinStats mobile app and web. You can now visualize real-time token distribution, identify wallet clusters, and explore token history across chains, all with a single tap. Just open the app on your phone, scroll through the tabs on your favorite token, and dive into the insights.
Web Portfolio Performance Upgrades
We’ve also added some new portfolio charts that have numerous variables to give you a 360-degree look, allowing you to make the best possible decisions.
Portfolio Value – This shows the total value of your portfolio over time, based on the selected currency and time range. Each point reflects how much your holdings were worth at that moment, updating continuously with live market prices. You can select multiple currencies at once to compare your portfolio value across different terms.
Cumulative Profit and Loss – This is your total profit or loss building up over time. ‘Cumulative’ means each point includes all gains and losses since the start of the selected period, not just that day’s change.
Profit and Loss by Range – Your profit or loss for each selected time period (hour, day, week, month, or year). Each point reflects only that period’s result.
Portfolio vs Market – Your portfolio’s performance comparison to selected benchmarks. All lines start from the same value at the beginning of the chosen period, so you can easily see how your portfolio would have grown or declined compared to holding only that asset or index.
Inflows and Outflows – Your portfolio’s asset movements over time. You can choose to view only inflows (green bars), only outflows (red bars), or both together. When both are shown, each bar displays the net result of inflows and outflows for that timestamp.
Project Integrations
We’re constantly integrating the latest projects, wallets, and exchanges to deliver the best possible user experience. While we already offer the most integrations on the market, we’re not stopping here. We are adding new platforms every week. Recently we supported:
Chains:
XDC Network • Duckchain • Casper Network • Zcash • Plume Network • XRPL Blockchain • Orderly Network • Monad Chain • DIONE Protocol (Odyssey)
Exchanges:
OO and OP in Kraken Futures • On-Chain Earn for Bybit • Bybit Earn transaction history • Staked Tron
DEXes:
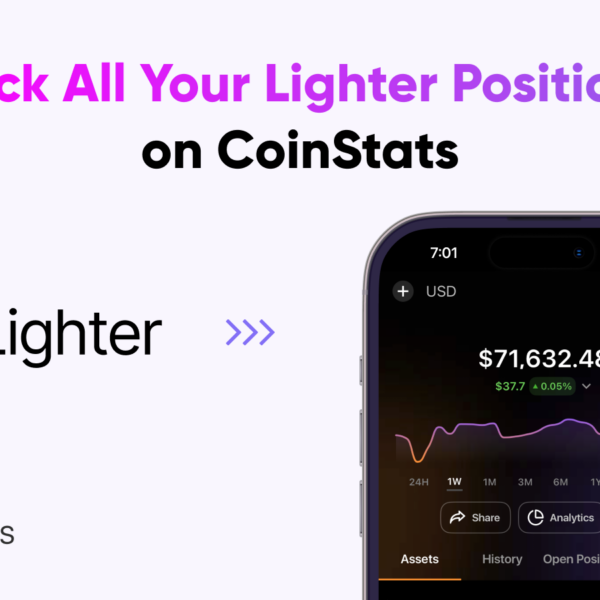
Lighter DEX • DiamondSwap (Odyssey) • Extended DEX Support • Folks Finance
Wallets:
Guarda Wallet • Zerion Wallet
That’s a wrap for this time. To keep up to date day to day, we suggest you follow us on our X. Until next time!