
SUI Price Prediction: The Final Countdown Before a Crypto Explosion

0
0

Something's building up in the SUI charts right now, and traders can feel it.
The sui price prediction talk has picked up because the price is sitting at a spot where it basically has to make a decision: go big or fall back hard.
Two patterns, one on the daily chart and one on the 4-hour chart, are both pointing at the same thing: a breakout or breakdown is close.
A Quick Look Back at SUI
SUI is known as one of the faster, more developer-friendly blockchains out there. It has quick transaction speeds and a growing list of apps being built on it.
It's not just another coin-riding hype; real projects keep launching on it, which has kept SUI in the conversation even when the market has been quiet.
But price hasn't always kept up with all that building, and that gap is exactly what's playing out on the charts this week.
Where SUI Sits Right Now
$SUI is trading close to $0.74 right now, up almost 2% on the day. Not a huge move by itself, but it's happening at a spot both timeframes agree matters.
The daily chart has the price stuck inside a shrinking triangle, and the 4-hour chart has it riding an ascending channel that's starting to weaken.
Two setups, same spot, same tension.
Liquidation Data Shows Longs Taking the Hit
According to Coinglass liquidation data, make it pretty clear who's been getting hurt lately.
Over the past 24 hours, SUI saw $861.54K in total liquidations, and most of that $786.43K came from long positions, with only $75.10K from shorts. 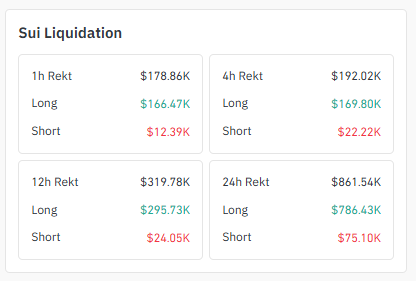
That's a heavy one-sided hit. Break it down by shorter windows, and it's the same story. In the last hour, $178.86K got liquidated, with $166.47K of that being longs.
Over 4 hours, $192.02K total, with $169.80K from longs. And over 12 hours, $319.78K total, with $295.73K coming from longs.
Traders betting on the channel holding keep getting caught out during this pullback, which matches the pressure showing up near the 4H channel support.
Exchange Volume Heatmap Shows Where the Big Money Is
Binance is running the show here, with $122.18M in SUI futures volume way ahead of everyone else.
MEXC comes in second at $73.94M, still solid but not close to Binance. After that it's a tight group: BingX at $50.78M, OKX at $48.48M, and Bybit at $45.12M. 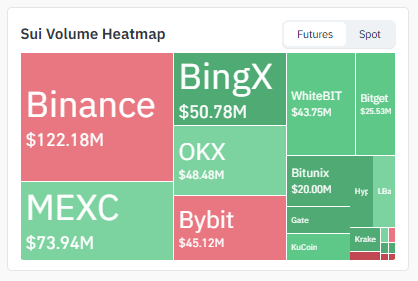
WhiteBIT ($43.75M), Bitget ($25.53M), and Bitunix ($20.00M) fill out the middle, with Gate, KuCoin, and Kraken picking up smaller amounts.
This spread is actually a good sign. Volume isn't stuck on just one exchange, so SUI's price isn't at the mercy of a single order book.
When liquidity is spread across several big venues like this, big moves usually happen with less nasty slippage.
4-Hour Chart: Ascending Channel Losing Its Grip
On the 4-hour chart, the story looks a bit different. SUI has been climbing inside an ascending channel, bouncing off the lower trendline for support each time and getting turned away at the upper trendline.
Right now the price is pulling back toward that lower support again, sitting near $0.7328.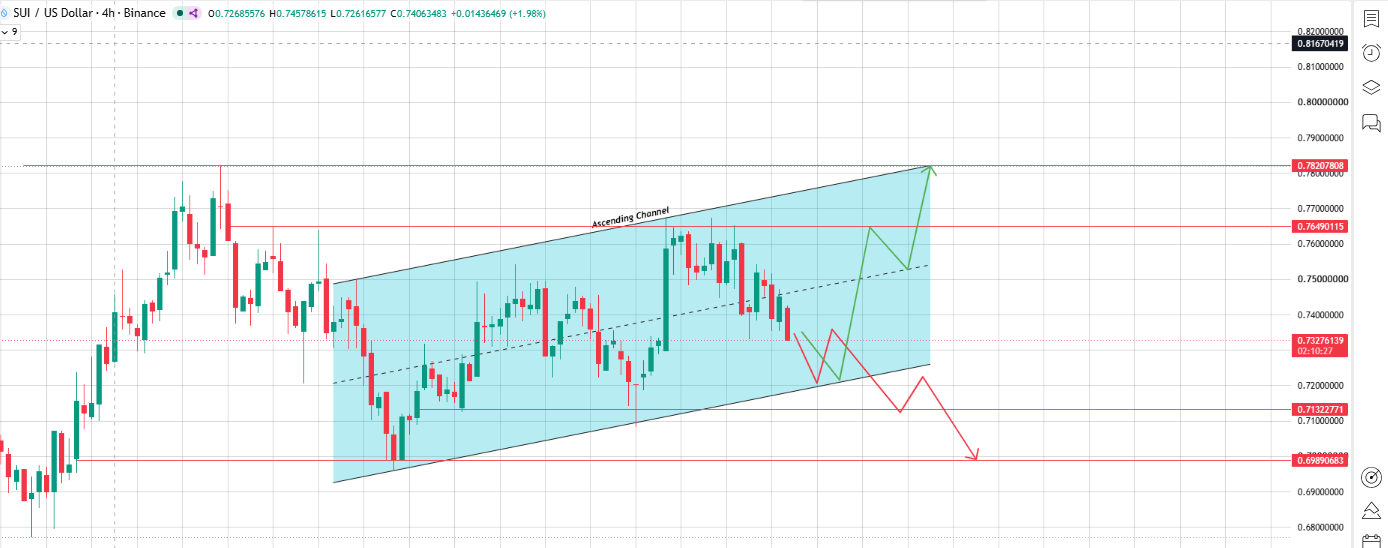
Source: Chart Taken From TradingView
If price holds the channel and bounces off the lower trendline again, a breakout above $0.7649 would open the path toward $0.7821, which would show the uptrend is still alive.
But if the pullback goes deeper and the price breaks below the channel's lower boundary near $0.7132, that's a sign the uptrend is cracking.
A confirmed break there could send the price down to $0.6989 next. The channel still looks bullish on paper.
But this pullback is the real test of whether buyers are still in control, and it's the same zone some traders are watching for a possible liquidity sweep before any real reversal.
Short-Term Support & Resistance (4H)
| Level | Price | Importance |
|---|---|---|
| Resistance 1 | $0.7649 | Channel breakout resistance |
| Resistance 2 | $0.7821 | Extended bullish target |
| Support 1 | $0.7328 | Immediate intraday support |
| Support 2 | $0.7132 | Channel lower boundary, key support |
| Support 3 | $0.6989 | Bearish breakdown target |
Daily Chart: Symmetrical Triangle Getting Tighter
On the daily chart, SUI has been forming a symmetrical triangle. Lower highs are coming down from above, higher lows are pushing up from below, and the two lines are close to meeting.
The price is sitting currently at $0.7315, basically right at the tip of the triangle where something has to give soon. 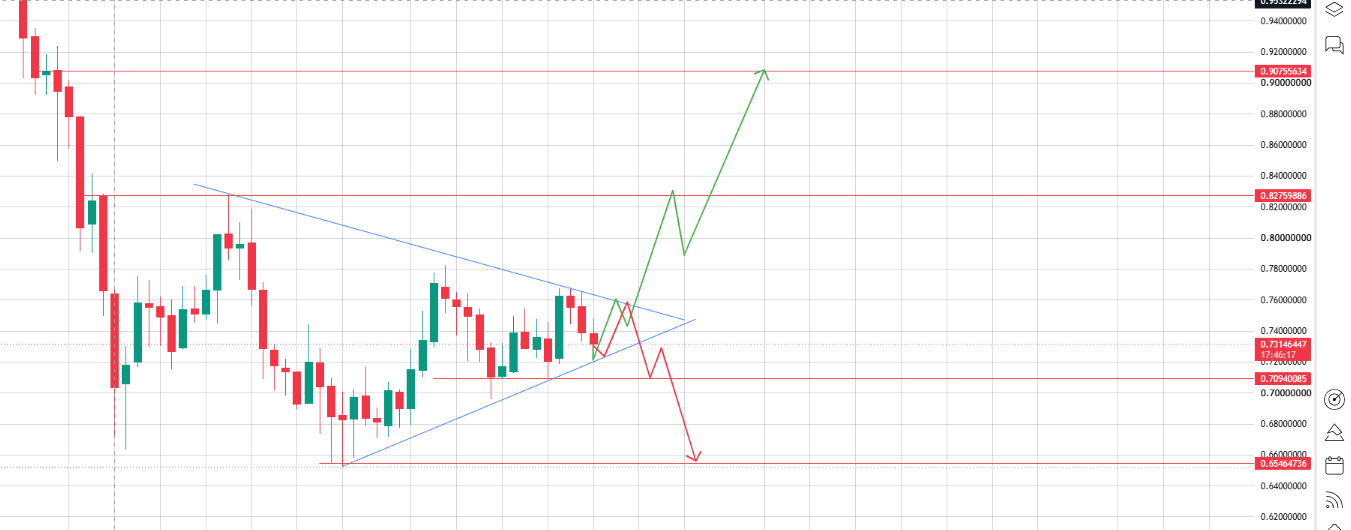
Source: Chart Taken From TradingView
If the price breaks out above the triangle and holds, the first target is $0.8276, with a bigger move possible toward $0.9076 if buyers keep pushing.
That second level is close to SUI's recent highs, so clearing it would be a big deal.
If the triangle breaks the other way, the first support to watch is $0.7094. Losing that opens the door to a deeper drop toward $0.6546.
Triangles like this usually make a real move once they break; the tightening range itself is a sign that something's about to happen.
It's worth noting some chart analysts on X are already flagging this exact support zone as a spot where the market might grab liquidity before reversing, rather than a clean breakdown. More on that below.
Long-Term Support & Resistance (Daily)
| Level | Price | Importance |
|---|---|---|
| Major Resistance 1 | $0.8276 | Triangle breakout target |
| Major Resistance 2 | $0.9076 | Extended bullish target, near recent highs |
| Major Support 1 | $0.7094 | Triangle apex support |
| Major Support 2 | $0.6546 | Bearish extension target |
Social Sentiment: Traders Watching a Liquidity Sweep Setup
Chart analysts on X are watching this exact zone too.
According to Trader Umair Orakzai, SUI failed to break the inverse head-and-shoulders neckline, pointing out that the size of that rejection candle was significant. 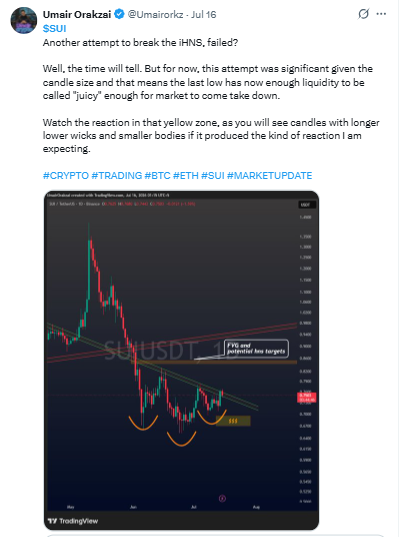
It means the last low now has enough liquidity sitting below it to be "juicy" enough for the market to come take it out.
His call: watch the reaction in the yellow zone below the current price.
If the setup plays out the way he expects, that area should show candles with longer lower wicks and smaller bodies, the classic signature of a liquidity grab followed by a bounce rather than a straight breakdown.
His chart also flags a fair value gap (FVG) with potential key targets sitting just above, lining up with the idea that a dip lower could still set up a move back toward resistance.
It's a useful reminder that the support zone SUI is sitting on isn't just a technical line; some traders think it's exactly the kind of level the market wants to sweep before making its real move.
SUI Price Scenarios: Bullish, Neutral, Bearish
| Scenario | Trigger | Price Targets |
|---|---|---|
| Bullish Breakout | Daily close above triangle resistance or 4H reclaim of $0.7649. | $0.8276 → $0.9076 |
| Neutral / Range-Bound | Price stays trapped between $0.7132–$0.7649 while the triangle apex holds. | Continued chop near current levels |
| Bearish Breakdown | Daily close below $0.7094 or 4H loses $0.7132 support. | $0.6989 → $0.6546 |
Final Outlook: SUI Needs Bitcoin and Ethereum to Play Along
Like most altcoins, SUI's next move depends a lot on Bitcoin and Ethereum.
If Bitcoin stays strong and Ethereum keeps climbing, that kind of backdrop could help SUI clear both the triangle resistance and the channel resistance, opening the door toward $0.83 and beyond.
But if the majors turn lower or the overall market mood sours, SUI's setup triangle plus channel is more likely to break down together, sending the price toward the $0.71–$0.65 zone.
Right now, SUI is genuinely at a crossroads. Both the daily and 4-hour charts are squeezing tight at the same time, which usually means whichever way this breaks, it won't be a slow move.
And if the liquidity sweep some traders are calling for does play out first, don't be surprised if the real move only kicks off after one more dip into support.
Disclaimer: This article is for informational purposes only and should not be considered financial advice. Cryptocurrency markets are highly volatile; always do your own research before making investment decisions.
0
0

 从同一位置管理所有加密资产、NFT 和 DeFi 资产
安全地关联您正在使用的投资组合,以开始交易。


