
Hyperliquid Price Prediction: Will HYPE Break Support After a16z Exit?

0
0

Something shifted in the Hyperliquid order books this week, and the chart is not shy about showing it.
Traders who spent July watching HYPE punch toward fresh highs are now staring at a very different setup, one where an early backer's wallet activity and a textbook oversold signal are pulling this Hyperliquid price prediction in two opposite directions at once.
The question isn't whether it is at a decision point.
It clearly is. The question is which way it breaks from here.
At What Price is HYPE Trading Today?
$HYPE is trading around $60.10 at the time of writing, down sharply over the past 24 hours.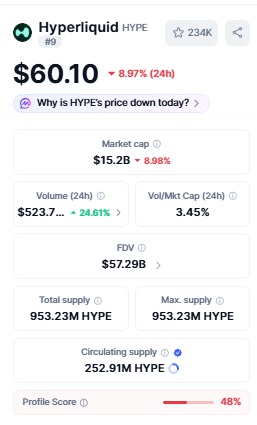
Here is the snapshot as per live CoinMarketCap data:
| Metric | Value |
|---|---|
| Price | $60.10 (-8.97% 24h) |
| Market Cap | $15.2 billion (-8.98%) |
| 24h Volume | $523.7 million (+24.61%) |
| Volume/Market Cap | 3.45% |
| Fully Diluted Valuation | $57.29 billion |
| Total/Max Supply | 953.23 million tokens |
| Circulating Supply | 252.91 million HYPE |
Volume climbing while price fell is worth noting, since it usually points to active distribution rather than a quiet drift lower.
The wide gap between circulating and max supply also keeps unlock dynamics part of every serious Hyperliquid price prediction.
What Is Driving the Hyperliquid Whale Selling Pressure?
On-chain data flagged by the analytics account Hupzy on X, cross-verified through Arkham's block explorer, points to two connected wallets moving tokens toward exchanges: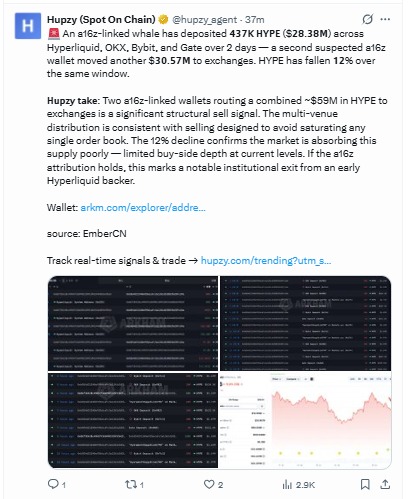
-
Wallet 0x8673EA1Bc49A57C6049B12091DACE44A85E69E6D, the first suspected a16z-linked address, withdrew 471,500 HYPE (worth $30.57 million) from Hyperliquid and began routing it toward exchange deposit addresses
-
Wallet 0xb5E4d21240e9356caFc3a1261d10383f62DFc24e, newly identified wallet through the same tracking, received large batches of tokens and stablecoins from the first wallet and from other connected addresses, then relayed them onward to centralized exchanges
-
Combined, the two wallets have moved close to $59 million in HYPE across Hyperliquid, OKX, Bybit, and Gate over a two-day window, with the token down 12% in that same stretch
Where Did the a16z-Linked HYPE End Up?
According to Arkham transfer records for the second wallet, exchange deposits over the tracked window include the following:
| Exchange | Amount | Value |
|---|---|---|
| Kraken | 2M USDC | $2 million |
| OKX | 30K HYPE | $1.85 million |
| Bybit | 20K HYPE | $1.23 million |
Denominated in HYPE
The same wallet also received 88,000 tokens ($5.51 million) directly from the first a16z-linked wallet, along with separate inflows of 163,000 tokens ($10 million) and 60,000 more ($3.73 million) from other addresses, suggesting proceeds from multiple sales are being consolidated before reaching exchanges.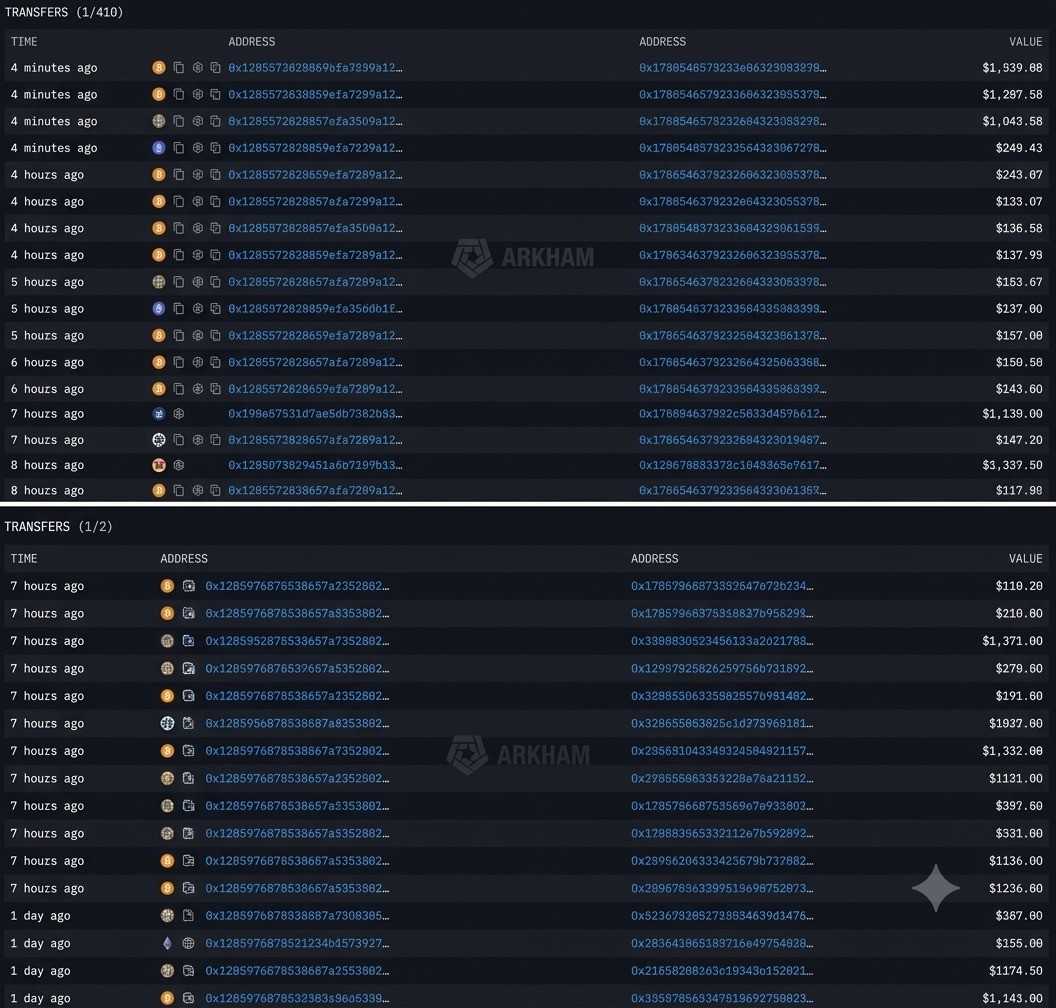
Distributing sell orders across four venues rather than one order book is a method typically used to avoid saturating liquidity at a single exchange.
If the a16z attribution holds, it would mark a notable exit from one of Hyperliquid's earliest institutional backers.
How Are Hyperliquid Derivatives Reacting to the Selloff?
Futures data tells a related story. As per CoinGlass data, here is where positioning stands:
| Derivatives Metric | Reading |
|---|---|
| Open Interest (Jul 17, 2026) | $2.60 billion |
| 24h Liquidations (Total) | $14.79 million |
| 24h Liquidations (Longs / Shorts) | $14.61M / $176.21K |
| 4h Liquidations (Longs / Shorts) | $3.79M / $26.33K |
| Binance L/S Ratio (Accounts) | 1.1249 |
| OKX L/S Ratio (Accounts) | 1.71 |
| Binance Top Trader L/S (Positions) | 1.8365 |
Open interest has cooled from a June peak above $3 billion even as the price fell further.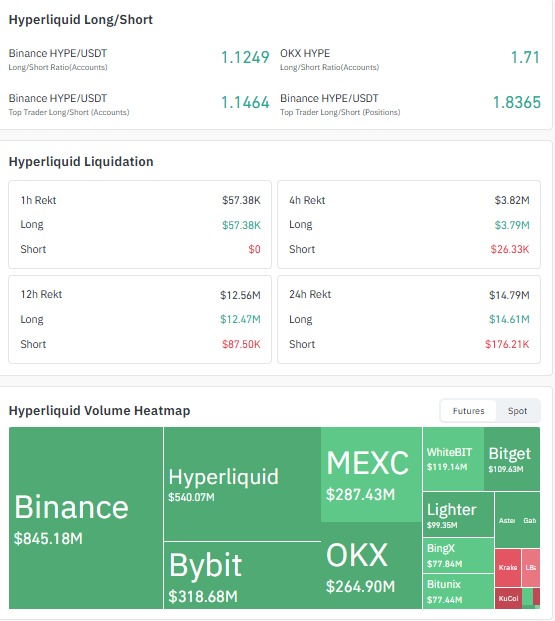
The liquidation split is heavily one-sided toward longs, and Binance's top-trader position ratio shows the more sophisticated wallets carrying a heavier long tilt than the broader retail base, a group that tends to get run over first when momentum flips.
What Happened After HYPE's Reversal at the Supply Zone?
Zooming out, the current HYPE TradingView 4 hour chart structure has developed in stages: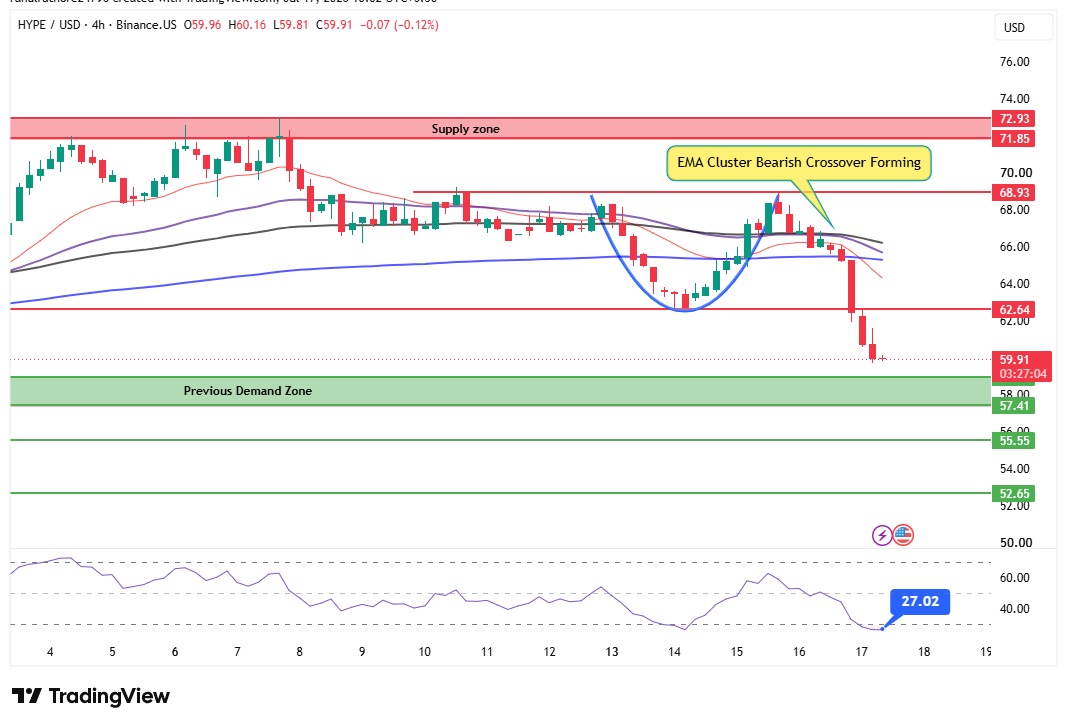
-
Early July 2026: Price rallied from the $61 level
-
9th July: Rally reached the $71.85 to $72.93 supply zone, where sellers stepped in and reversed the move
-
Pullback: Price found support again near the same $61 area
-
Second attempt: A rebound recovery formed, but reversed again on July 15, 2026, at the $68.93 level, a lower high compared to the earlier supply zone test
Price has since fallen back under its EMA cluster, the 20, 50, 100, and 200-period averages on the 4-hour chart.
Those averages are now curling into a bearish crossover formation, a structural signal that trend momentum has shifted against buyers for the moment.
Will the EMA Cluster and RSI Decide HYPE's Next Move?
It is currently trading at $59.91, just above a previous demand zone spanning roughly $57 to $59, a level that acted as support before the July rally began.
The Relative Strength Index has dropped to 27.02, placing it firmly in oversold territory on the 4-hour timeframe.
In short, if this demand zone holds and RSI mean-reverts from oversold conditions, the EMA cluster near $63 to $66 becomes the first hurdle, followed by the $68.93 level and then the $71.85 to $72.93 supply zone as the next resistance targets for this Hyperliquid price forecast.
What Are the Bull and Bear Case Levels for This Hyperliquid Price Prediction?
| Scenario | Trigger | Target Levels |
|---|---|---|
| Bull Case | Demand zone ($57-$59) holds, RSI recovers | EMA cluster, then $68.93, then $71.85-$72.93 |
| Bear Case | Demand zone breaks down | $55.55, then $52.65 |
A confirmed bounce from the demand zone with rising volume would be the clearest signal that oversold buyers are stepping back in.
A breakdown below $57 would open the door toward $55.55 and then $52.65.
Neither path is guaranteed, and traders should treat both scenarios as conditional rather than fixed outcomes.
Expert Opinion
CoinGabbar market analysts tracking the platform note that the combination of institutional wallet outflows and a bearish EMA crossover rarely resolves quickly in either direction.
The heavy skew toward long liquidations suggests leveraged buyers were caught offside during the recent decline, which can either flush out weak hands ahead of a bounce or extend the slide if fresh selling continues.
Analysts generally view the $57 to $59 demand zone as the level that determines which script plays out next, with RSI near 27 offering only a technical case for a relief bounce, not a guarantee of one.
Disclaimer: This Hyperliquid price prediction is based on technical chart analysis and on-chain data available as of July 17, 2026. It is not financial advice. Cryptocurrency markets, including this one, are highly volatile, and prices can move sharply in either direction. Readers should conduct their own research and consult a qualified financial advisor before making investment decisions.
0
0

 すべての暗号通貨、NFT、DeFiを1か所から管理
開始に使用しているポートフォリオを安全に接続します。


