
Uniswap price analysis: UNI unable to break above the resistance of $6.06
0
0

The Uniswap price analysis is showing bears are in the lead today. As the market opened, bears gained strength and drove the price down to the $5.9 range, where UNI recently found support, and bulls are attempting to take control, but it appears that they may fail. Previously, the coin was showing bullish momentum after the steep crashes observed after November 6, 2022. However, the cryptocurrency is finding it hard to break above the resistance level of $6.06, as the coin faced rejection at this level for the third time.
UNI/USD 1-day price chart: Uni bulls to gather more strength
The 1-day price chart for Uniswap price analysis shows that the UNI bulls are trying hard to take over the price function, but bearish supremacy is still dominating today’s price action. Despite suffering losses today, UNI/USD is still up exactly seven percent in value in the last 24 hours, which is due to the bullish price action of the previous trading session, as the crypto pair is trading at $6.01 at the time of writing. At the same time, Uniswap is at a loss of 7.84 percent if we look at the course of the last seven days.
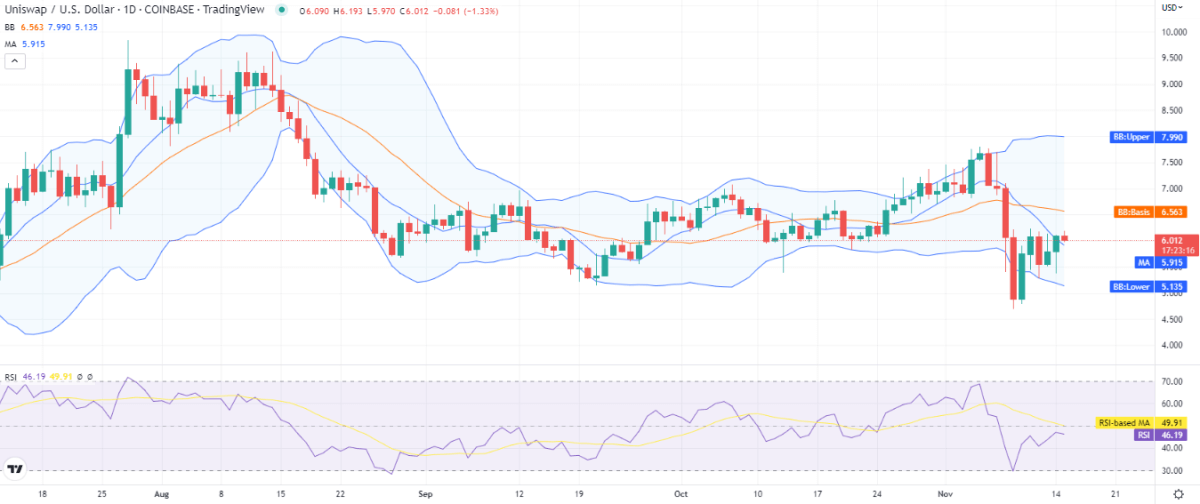
The volatility is relatively high and still increasing as Bollinger bands keep on expanding, with the upper band present at $7.99 representing the strongest resistance and the lower band present at the $5.13 level representing the strongest support for UNI. The average of Bollinger bands is at $6.56 above the price, and the moving average (MA) is also traveling below the price level, which is currently at $5.91. The relative strength index (RSI) is on the downtrend and is present at index 46 in the lower half of the neutral zone.
Uniswap price analysis: recent developments and further technical indications
The 4-hour Uniswap price analysis chart shows the bears caused heavy damage during the first four hours of the trading session today, but on the other hand, the bulls are trying to maintain the price levels as a small green candlestick has appeared on the chart. The day started with selling pressure, and bears provided resistance and took over the market for the first four hours. They may continue in the coming hours as well, but bulls may take the charge again.
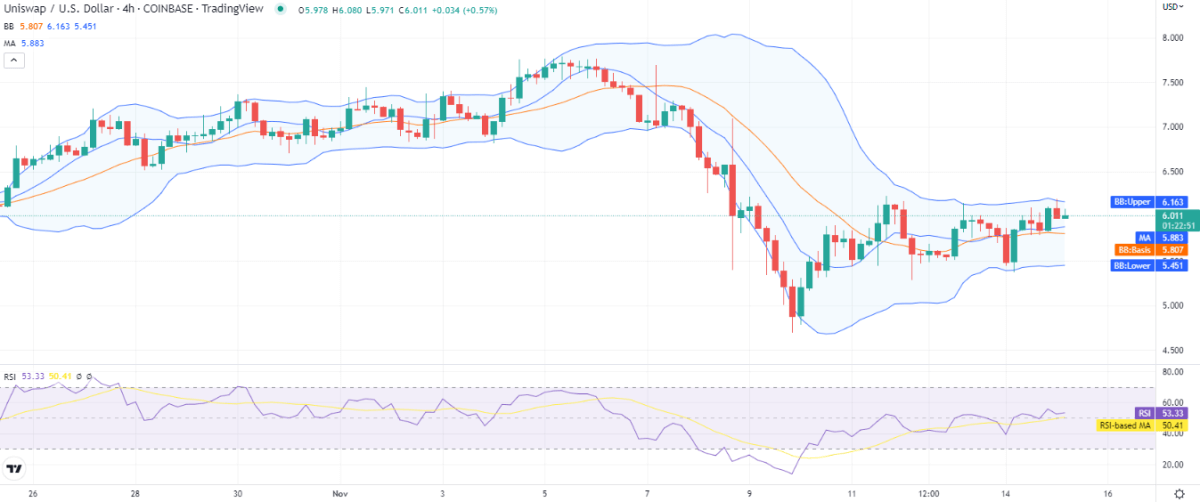
The volatility is comparatively low, as Bollinger bands show, with the upper end of the bands at $6.16 and the lower end at the $5.45 level. The moving average is at the $5.88 mark, and the Bollinger Bands average is at the $5.80 mark; both averages are below the current price level. The relative strength index (RSI) is moving in a horizontal direction and shows a score of 53 in the upper half of the neutral zone.
Uniswap price analysis: conclusion
The 1-day and 4-hour Uniswap price analysis show a bearish trend for today with clear signs of bearish shadows, but bulls are trying to take over at the moment. Further down the line today, if the buying momentum gains strength, then bulls may succeed in carrying the lead as the support is also present nearby, but if selling pressure accelerates again, then bears may stretch the leg and take cryptocurrency further down towards the support level of $5.75.
Disclaimer. The information provided is not trading advice. Cryptopolitan.com holds no liability for any investments made based on the information provided on this page. We strongly recommend independent research and/or consultation with a qualified professional before making any investment decisions.
0
0

 Gérez tous vos cryptos, NFT et DeFi à partir d'un seul endroit.
Connectez de manière sécurisée le portefeuille que vous utilisez pour commencer.


