
Fusionist crypto at $0.14: 14% upside vs 40% downside risk

0
0

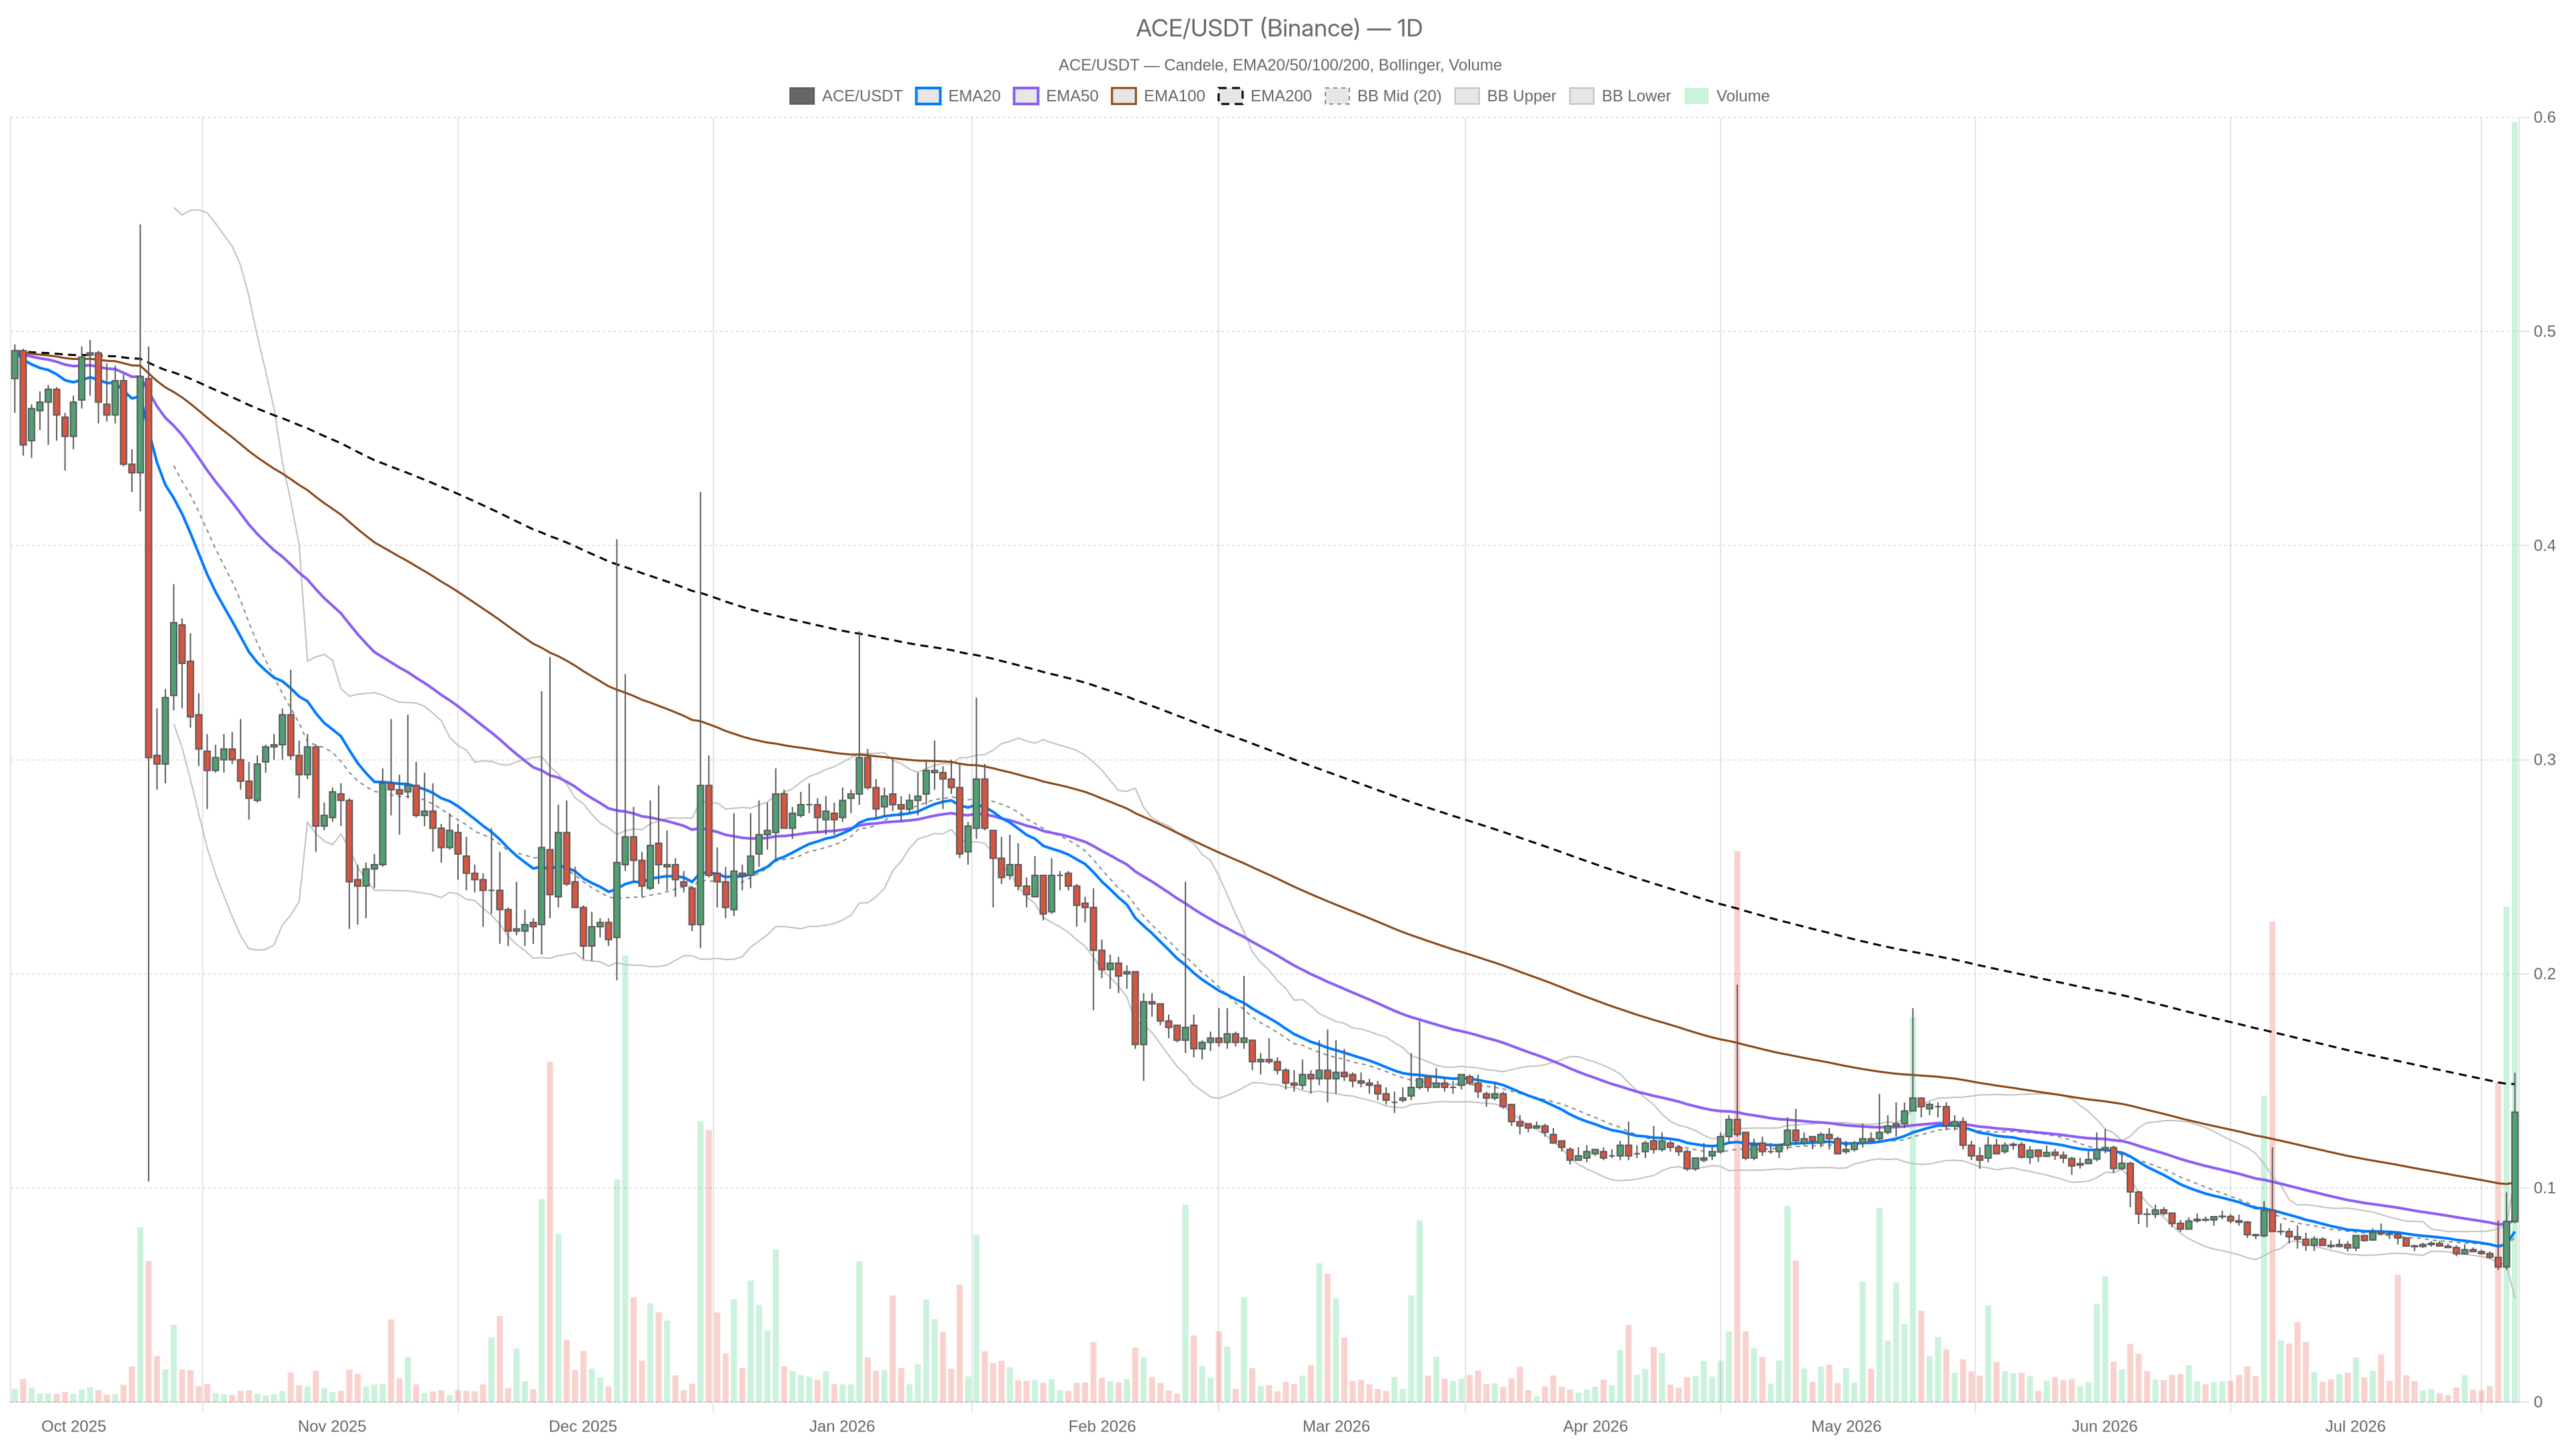
As of July 20, 2026, ACE/USDT trades at $0.14 — a price that tells two different stories. The recent rally for Fusionist crypto has pushed past short-term moving averages. Yet the daily EMA200 at $0.15 looms just above, creating a structural ceiling that coincides with overbought momentum readings.
Key takeaways
- ACE/USDT trades at $0.14 with daily RSI at an extreme 80.88, signaling overbought conditions.
- The daily EMA200 at $0.15 and R1 resistance at $0.16 form a tight structural ceiling directly above current price.
- Broader market context remains cautious: Bitcoin dominance at 56.5% and the Fear & Greed Index at 29.
- A confirmed break above $0.16 would flip the long-term outlook bullish; failure at $0.15 opens a path toward $0.09 support.
- Fresh long entries carry asymmetric risk with roughly 14% upside versus over 40% potential downside.
Daily Timeframe: The Bull Case Is Real, but Stretched
The daily chart paints a technically bullish but stretched picture for ACE/USDT. The EMA20 at $0.08 and EMA50 at $0.09 both sit well below current price, confirming near-term momentum. However, the daily RSI at 80.88 is one of the more extreme overbought readings outside a confirmed parabolic move. That level does not automatically trigger a reversal. Yet it meaningfully raises the cost of being wrong on a long entry. Markets can stay overbought, but they rarely stay this overbought without a sharp pullback or a period of consolidation.
The broader market backdrop adds further caution. Total crypto market cap hovers around $2.3 trillion with Bitcoin dominance at 56.5%, a reading that typically signals risk appetite remains concentrated in large caps rather than smaller tokens like ACE. The Fear & Greed Index at 29 — squarely in fear territory — reinforces that this rally is not happening in a euphoric environment. That makes the overbought reading on the daily chart far harder to dismiss.
The daily Bollinger Bands show the upper band at $0.11 and midline at $0.08, with ACE at $0.14 well beyond the upper band — strong momentum that is arguably running on fumes. The daily ATR of $0.01 reflects a low-volatility token where even a large daily swing is just a single cent.
The pivot point sits at $0.12, with R1 at $0.16 and S1 at $0.09, placing ACE in neutral-to-bullish territory between pivot and R1. The critical observation, however, is that the EMA200 at $0.15 and R1 at $0.16 form a tight cluster directly overhead. That confluence zone is where selling pressure is structurally likely to intensify. Breaking through $0.15–$0.16 with conviction would be genuinely significant; failing there would confirm the mean-reversion setup the daily RSI already hints at.
Hourly Structure: Momentum Holds, but the Push Is Fading
The hourly chart remains bullish, but the momentum is showing early signs of fatigue. The EMA stack — EMA20 at $0.11, EMA50 at $0.09, EMA200 at $0.08 — sits in perfect bullish order beneath current price. The MACD shows the line at 0.02 above the signal at 0.01, a positive spread confirming the intraday trend has not broken down. The hourly RSI at 75.35 is elevated but not at the extreme daily reading, suggesting marginally more room for continuation on the shorter cycle. That said, the hourly is not far from territory where it begins echoing the daily warning.
The hourly Bollinger Bands show the upper band at $0.16 and mid at $0.10, with price at $0.14 sitting in the upper half of the range but not yet at the band’s edge. This is a healthier positioning than what the daily shows — the hourly has not fully exhausted its upside bandwidth. Notably, the hourly pivot has both PP and R1 converging at $0.14, meaning current price trades right at the pivot cluster. Bulls need to hold this level to maintain credibility; any sustained drop below $0.14 on the hourly would begin shifting the intraday narrative.
15-Minute Chart: The Short-Term Tells a Different Story
The 15-minute chart tells a different story — one of cooling momentum and growing uncertainty. Price on this frame is $0.13, which already sits below the 15m EMA20 at $0.14. The regime is classified as neutral, not bullish. The RSI has cooled to 52.49 — essentially the midline, with no directional bias. Moreover, the MACD line and signal are both flat at 0.01. This is a short-term structure that has stopped trending. Whether that represents a healthy pause before another leg higher or an early warning of distribution is the key question, and the 15m alone cannot answer it.
The 15m Bollinger Bands are notably tight — upper at $0.15, mid at $0.14, lower at $0.13 — reflecting the current compression in realized volatility. Price sitting at the lower end of this tight band after a strong run is consistent with a short-term pullback finding support. However, it is also consistent with the beginning of a wider unwinding if buying pressure does not re-emerge quickly. Active traders should note that executing a long position right now carries the risk of chasing into a cooling move, even if the broader hourly and daily structure still points upward.
The Bullish Scenario and What Would Confirm It
A bullish continuation requires a clean break above the $0.15–$0.16 resistance cluster. If ACE sustains this move, the script demands a break above the daily EMA200 at $0.15, followed by a close above $0.16, which is R1 on the daily pivot. A breakout through that confluence zone on meaningful volume would reframe the technical picture entirely. The EMA200 flipping from resistance to support would mark the first time ACE trades in long-term bullish territory. In that scenario, the daily RSI being elevated becomes less of a warning and more of a confirmation that the asset is in a trending regime.
The bullish case is invalidated if ACE fails to hold the $0.12 daily pivot. A daily close below that level would signal the rally has stalled at the overhead resistance cluster. That would also suggest mean reversion toward the daily Bollinger midline at $0.08 is the more probable medium-term path.
The Bearish Scenario and What Would Confirm It
The bear case rests on a simple but reliable setup: overbought momentum meeting long-term moving average resistance. It simply requires the EMA200 at $0.15 to hold, combined with the daily RSI rolling over from 80.88. That configuration — overbought momentum encountering a long-term moving average — is one of the more dependable mean-reversion setups in technical analysis. A failure to break $0.15, followed by a close back below the $0.14 hourly pivot cluster, would set up a retracement toward $0.12–$0.13 as the initial target. The $0.09 S1 support becomes the deeper level in play if sellers gain real conviction.
The bearish case is invalidated by a confirmed daily close above $0.16, which would represent a structural breakout past every meaningful resistance level visible in the current data. At that point, bears would need to step aside and reassess.
Positioning, Risk, and the Honest Read
The short-term trend in ACE is real but showing its age — fresh entries at current levels carry asymmetric risk. The honest read on Fusionist crypto right now is this: the daily RSI at 80.88 is not a sell-immediately signal. It is a be-careful signal, and there is a meaningful difference. Traders already holding long positions from lower levels have a case for maintaining exposure, with a trailing stop anchored around the $0.12 daily pivot. Fresh entries at current levels, however, carry asymmetric risk: the upside to R1 at $0.16 is roughly 14%, while a reversion to the daily Bollinger midband at $0.08 would represent a loss of over 40%.
The market context — Fear & Greed at 29, Bitcoin dominance above 56%, and a broader crypto market that is cautious rather than exuberant — does not provide the rising-tide support that would make this overbought condition more forgiving. This is an environment where individual tokens need strong, independent catalysts to sustain moves against the macro headwind. Whether ACE has that catalyst is a fundamental question the technical data alone cannot answer. What the charts do say, clearly, is that the next few days around the $0.15 EMA200 level are defining for the medium-term trajectory of this asset.
FAQ
What is the current price of ACE/USDT?
As of July 20, 2026, ACE/USDT is trading at $0.14, positioned between the daily pivot at $0.12 and R1 resistance at $0.16.
Is ACE overbought on the daily timeframe?
Yes. The daily RSI stands at 80.88, which is an extreme overbought reading. While this does not guarantee an immediate reversal, it significantly raises the risk of a pullback or consolidation.
What are the key levels to watch for ACE?
The critical levels are the daily EMA200 at $0.15 and R1 resistance at $0.16 on the upside, with the daily pivot at $0.12 and S1 support at $0.09 serving as downside markers.
Disclaimer: This article is for informational purposes only and does not constitute financial advice, an investment recommendation, or a solicitation to buy or sell any financial instrument or cryptocurrency. The analysis provided is not indicative of future results. Investing in crypto assets and financial markets carries a high risk of capital loss. Always do your own research (DYOR) and consult a qualified financial advisor before making any decision.
Article produced with the assistance of artificial intelligence and reviewed by the editorial team.
0
0

 Կառավարեք ձեր բոլոր կրիպտարժույթները, NFT-ն և DeFi-ն՝ մեկ տեղից
Ապահովաբար կցեք ձեր օգտագործած պորտֆոլիոն՝ սկսելու համար: