Is UMA’s Bullish Rally Over? Indicators Signal Increased Bearish Momentum

2
0

- UMA’s value rocketed 161.5% in a week, hitting a 20-month high.
- A bearish phase engulfs UMA as it faces resistance, dipping 10 % after a bullish surge.
- Technical indicators signal potential UMA price decline if bearish strength grows.
The Universal Market Access Protocol’s native token, UMA, has witnessed an extraordinary surge, catapulting its value by 161.5% in just a week. This upswing pushed its price to a 20-month high, reaching a peak at $6.73 before facing stiff resistance. This surge was a shift from a long period of stagnation to a bullish trend, signaling a potential era of prolonged growth for UMA.
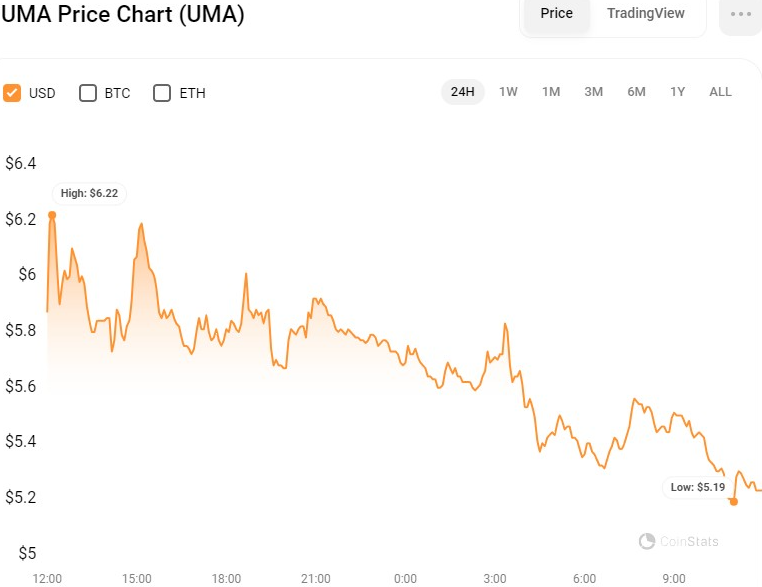
However, in the last 24 hours, bears have had the upper hand, dipping the price from an intra-day high of $6.22 to a low of $5.19, where support was established. UMA was trading at $5.23 at press time, a 10.15% dip from the intra-day high.
The last week’s rally in UMA’s value can be traced back to several pivotal developments. Notably, the anticipated launch of ‘Oval,’ a revolutionary crypto solution aiming to reclaim over $100 million lost annually to Maximal Extractable Value (MEV), has been a k…
The post Is UMA’s Bullish Rally Over? Indicators Signal Increased Bearish Momentum appeared first on Coin Edition.
2
0


 Կառավարեք ձեր բոլոր կրիպտարժույթները, NFT-ն և DeFi-ն՝ մեկ տեղից
Ապահովաբար կցեք ձեր օգտագործած պորտֆոլիոն՝ սկսելու համար:


0
0


0
0