
Will Radworks Price Go Up? RAD Price Prediction 2026

0
0
Radworks (RAD) jumped more than 20% in a single day, pushing 24-hour volume past $27M and pulling the token off its late-July all-time low. Here's the full RAD price prediction: key resistance and support levels, whale and supply risks, and a bear/base/bull forecast through 2026.
Key Takeaways
-
Radworks (RAD) is up 20.13% in 24 hours to $0.2515, with volume climbing 691% to $27.58M.
-
The token is trading roughly 25% above its July 29, 2026, all-time low of $0.20 but remains over 99% below its 2021 all-time high.
-
Key resistance sits near $0.2843–$0.307; key support sits near $0.2085, with a deeper floor at the $0.20 cycle low.
-
A Vol/Mkt Cap ratio of 185.66% signals unusually heavy turnover relative to size, a pattern often tied to short-term speculative flow.
-
Base-case RAD price prediction: choppy consolidation in the $0.21–$0.29 band over the next 7–30 days, with direction hinging on whether elevated volume holds.
Will RAD Price Go Up? Radworks Price Prediction 2026
RAD price prediction searches have spiked after Radworks jumped 20.13% in 24 hours to $0.2515, according to live Radworks market data, with the token's market cap rising to roughly $14.85M. The move comes less than two weeks after $RAD touched a fresh all-time low of $0.20 on July 29, 2026, making this bounce a recovery move rather than a continuation of an existing uptrend.
Market Overview: Price Action and Volume
Trading data shows RAD's 24-hour range spanned a low of $0.2085 to a high of $0.2843, with the fully diluted valuation sitting at $25.15M against the current $14.85M market cap. Circulating supply stands at 59.08M RAD out of a roughly 100M max supply, putting just under 41% of total tokens still outside active circulation. Readers keeping tabs on the broader market alongside this move can browse today's crypto news for additional context on sector-wide flows.
Catalyst: Renewed Volume and the Bound Exchange Narrative
The immediate driver behind today's move appears to be a sharp jump in trading activity rather than a single scheduled event; 24-hour volume rose 691% even as price gained "only" 20%, a ratio that typically points to short covering or a burst of speculative buying rather than steady accumulation.
Community chatter has also continued to frame $RAD as the historical and technical precursor to the newer The Bound Exchange platform, a narrative that traders have kept alive in recent community discussion.
Community and Developer Signals
Developer-side updates have echoed a similar theme, with builders flagging ongoing protocol activity even through the token's recent slump, a signal some in the privacy and open-source space have been tracking closely.
Broader sentiment around AI-adjacent and governance tokens has been mixed lately, and readers comparing RAD's move to other small-cap setups can check the latest AI crypto news for context on which sectors are seeing inflows.
Tokenomics and Supply Analysis
RAD's total and max supply sit at roughly 100 million tokens, with 59.08 million (59.08%) already circulating, a far tighter unlock overhang than many newer small-cap tokens carry. 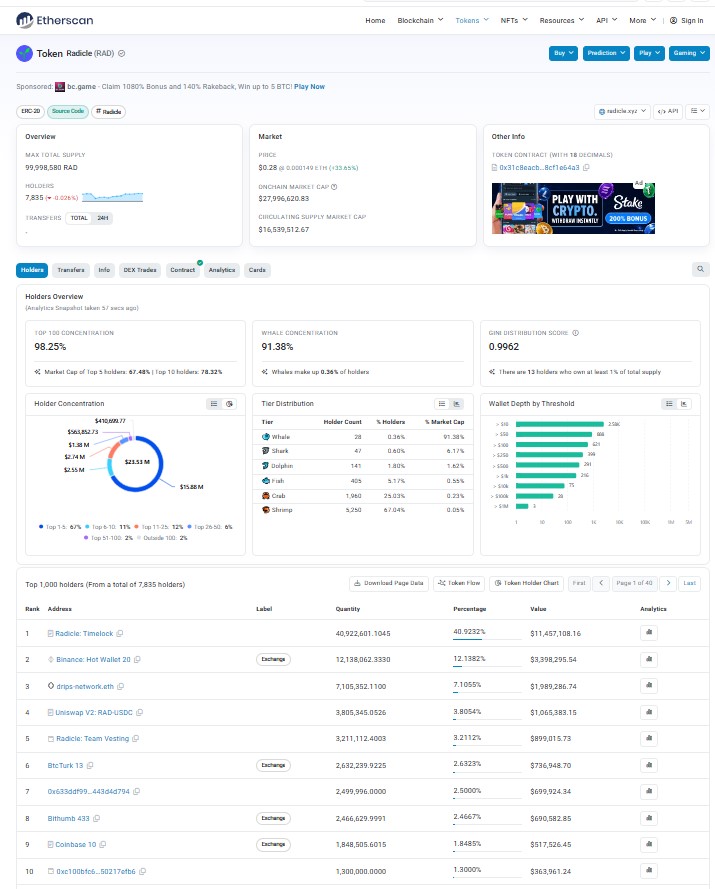
Holder concentration data from exchanges has generally shown RAD's supply spread across a wide developer and community base rather than concentrated in a handful of unlabeled wallets, and anyone can verify wallet distribution and contract activity directly on-chain.
Still, with over 40% of supply yet to circulate, any change to emission pace is worth monitoring. Traders watching for fresh distribution events or a possible exchange relisting may want to check the coin events calendar for upcoming unlocks or listings.
Can RAD Reach $1? Technical Analysis and Key Levels
Daily Chart (1D): Breakout Confirmed, But Overbought
RAD finally punched through that descending trendline it had been stuck under since early June; traders are calling it a "descending channel breakout," and it's a meaningful shift.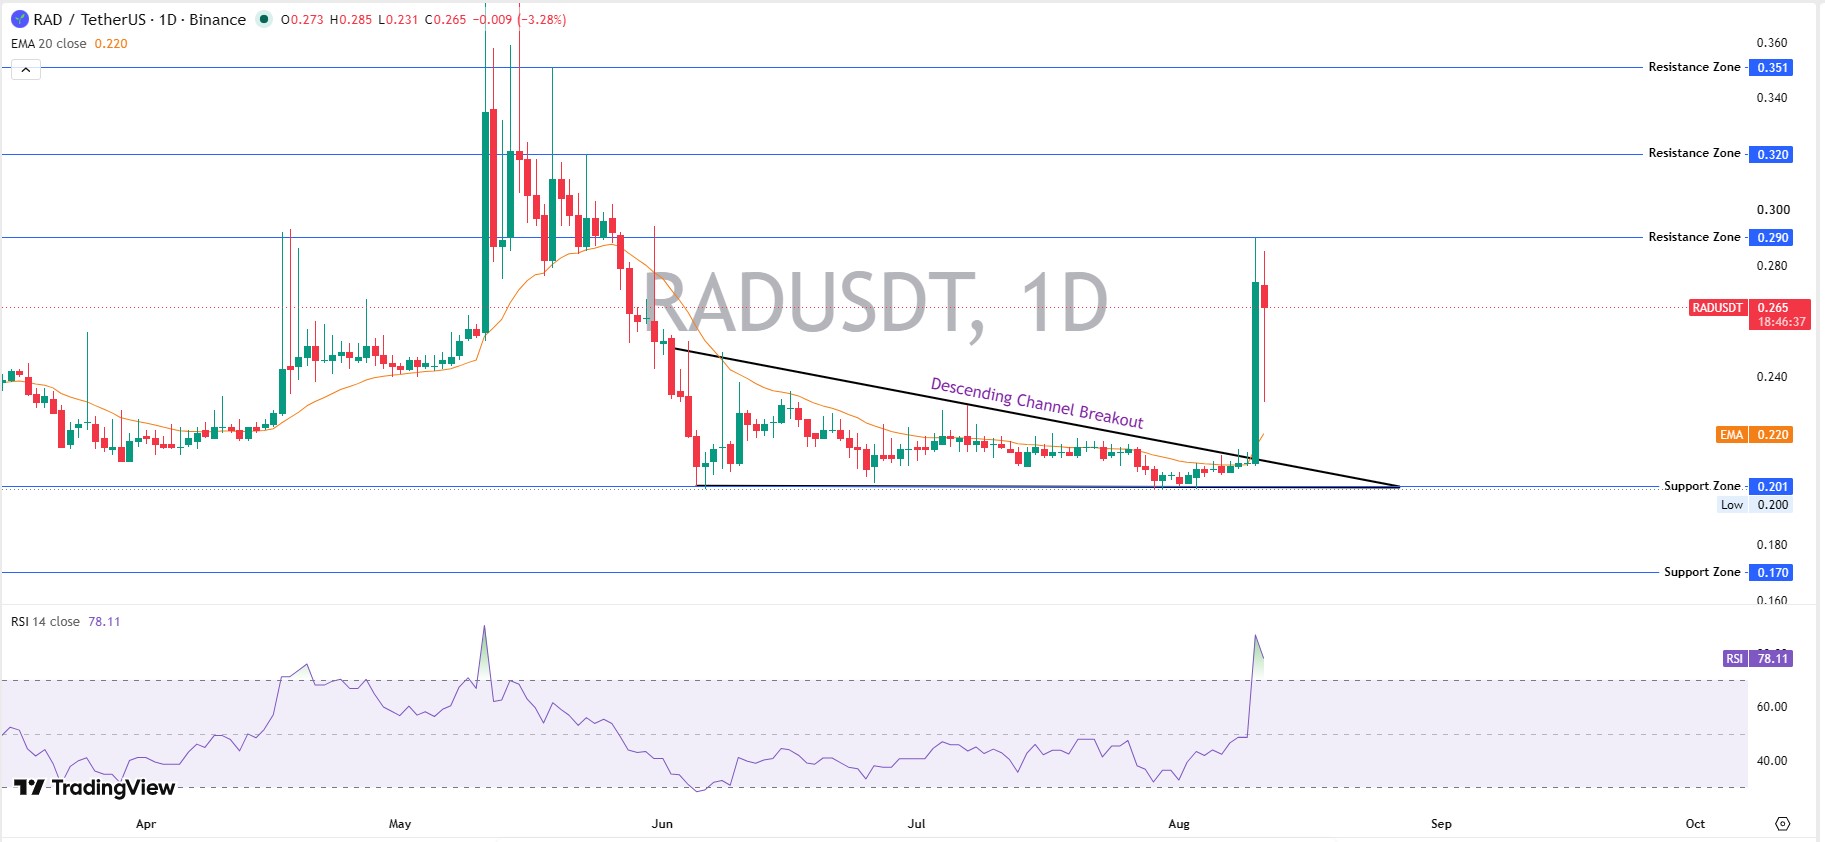
Price ran up to $0.285 intraday but couldn't hold there, slipping back to trade around $0.265, down about 3.28% on the day. That kind of pullback after a breakout usually just means people are locking in gains, not that the move has failed.
Worth noting: RSI has jumped to 78.11, which is deep overbought territory, so don't be surprised if price cools off or comes back to retest that trendline before pushing higher again. The 20 EMA is way down at $0.220, so the short-term trend is clearly leaning bullish for now.
Key levels to watch:
-
Resistance: $0.290, $0.320, $0.351
-
Support: $0.201
-
Invalidation: a close back under $0.22–$0.24 would put the breakout in doubt
Weekly Chart (1W): The Bigger Picture Turns Bullish
Zoom out to the weekly view, and things get more interesting. RAD's been grinding lower inside a descending channel since roughly September 2025, printing lower highs and lower lows ever since it crashed from that $0.75 peak.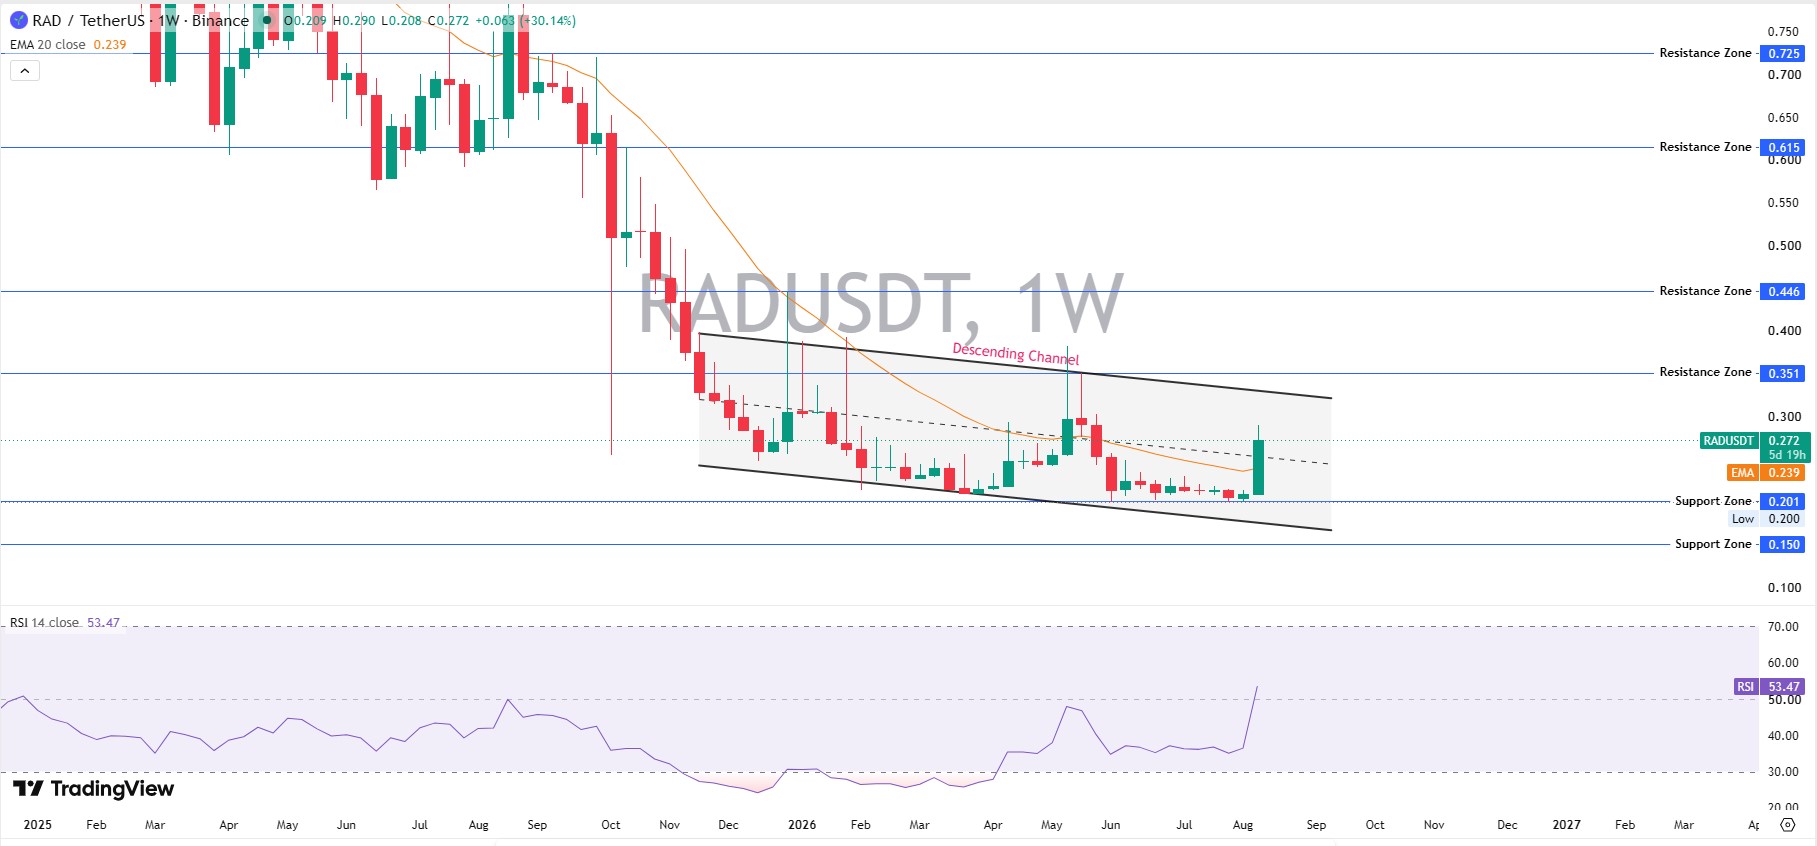
But this week's candle changed the picture; it trades up 30.14% at $0.272, breaking above both the channel's upper boundary and the 20 EMA ($0.239). That's the strongest weekly close this token has posted in a long while.
RSI has also climbed to 53.47, finally escaping the 30 - 40 range it had been stuck in throughout the downtrend, which suggests this isn't just noise; momentum genuinely seems to be turning. A weekly breakout carries a lot more weight than a daily one, since it reflects a longer-term shift rather than a one-off spike.
Key levels to watch:
-
Resistance: $0.351, $0.446, $0.615, $0.725
-
Support: $0.150 - $0.201 zone, which needs to hold for this base to stay intact
So, Can RAD Reach $1?
Getting to $1 would mean $RAD roughly quadrupling from where it sits now, not impossible in crypto, but it would require clearing every resistance band above in succession, starting with $0.351 and eventually breaking well past $0.725.
The weekly breakout is a genuinely encouraging sign for the medium-term trend, but the daily chart's overbought RSI suggests the next move might be sideways-to-down before any real push higher. For now, $1 is a long-term possibility contingent on sustained momentum, not a near-term target.
RAD Price Prediction: Bear, Base, and Bull Case
| Timeframe | Bear Case | Base Case | Bull Case | Probability | Key Level | Invalidation |
| 7-Day | Pullback toward $0.2085 support as volume fades | Consolidation between $0.21–$0.29 | Push to $0.307 resistance if volume stays elevated | 30% / 45% / 25% | $0.2085 / $0.25 / $0.307 | Daily close below $0.20 |
| 30-Day | Reversion toward the $0.20 cycle low | Range between $0.21–$0.34 as extension levels are tested | Extension to $0.421 if renewed volume sustains | 30% / 45% / 25% | $0.20 / $0.30 / $0.421 | Loss of the $0.20 all-time-low floor |
| Early 2027 | Drift back toward sub-$0.20 levels if broader altcoin demand stays weak | Consolidation between $0.20–$0.50 as supply and adoption roughly balance | Extension toward $0.75–$1.00 if a sustained narrative catalyst emerges | 30% / 50% / 20% | $0.20 / $0.35 / $1.00 | Circulating supply growth outpacing renewed demand |
This RAD price prediction leans base-case: the token has confirmed it can bounce hard off cycle lows, but a single volume spike is not yet proof of a sustained trend. Traders tracking correlated majors may also want to keep an eye on the Bitcoin price prediction for 2026, since small-cap altcoins like RAD tend to move with broader market risk appetite.
How High Can RAD Go? Risks and Invalidation
The biggest risk to any bullish RAD price prediction is that today's volume spike proves temporary; a 691% jump in trading activity against a 20% price move is a pattern that has historically preceded quick pullbacks once early buyers take profit.
RAD also remains an Ethereum-based token, so shifts in gas costs, network activity, or a rotation away from smaller ecosystem tokens toward majors covered in the Ethereum price prediction 2026 could pressure RAD independent of its own fundamentals.
Macro conditions matter too: broader risk appetite tied to Federal Reserve policy decisions can pull capital away from small-cap tokens like RAD on short notice, regardless of project-specific catalysts.
Regulatory developments such as the CLARITY Act's progress are a separate variable worth watching, since shifting policy clarity tends to move sentiment across the wider altcoin market, including governance-focused projects like Radworks.
Glossary
-
RSI (Relative Strength Index): A momentum indicator measuring the speed of price moves; above 70 typically signals overbought conditions.
-
Fibonacci Extension: A technical tool projecting potential price targets beyond a prior swing high or low.
-
FDV (Fully Diluted Valuation): A token's price multiplied by its max supply, showing total value if every token were circulating.
-
Vol/Mkt Cap Ratio: A measure of trading turnover relative to market size; higher ratios often signal speculative, short-term activity.
-
Cycle Low: The lowest price a token has reached since its last major peak.
Conclusion
Radworks' bounce off its July all-time low is notable, but it's built on a single day of unusually heavy volume rather than a confirmed trend reversal. Traders following this RAD price prediction should weigh the $0.2843–$0.307 resistance band against the $0.20–$0.2085 support zone and keep watching whether trading activity stays elevated in the sessions ahead. For those tracking multiple small-cap setups at once, the broader price prediction hub covers similar breakout and recovery patterns across the market.
Disclaimer: This is not financial advice. Cryptocurrency markets are highly volatile; do your own research before trading.
0
0

 Administra todas tus criptomonedas, NFT y DeFi desde un solo lugar
Para comenzar, conecta de forma segura el portafolio que estés utilizando.