
Ethereum Price Hit $2,600 Then Stalled: Here Is What Decides the Next Move

0
0

Ethereum spent most of the last three weeks doing very little, then packed an entire month of drama into a single session. On 11 September, $ETH ripped from roughly $2,437 to as high as $2,667, printed its first move above $2,600 in around eight months, and then handed most of it straight back. As of 14 September, the Bitstamp ETHUSD pair is trading near $2,505, up a rounding-error 0.19% on the session.
That combination, a violent spike followed by three days of nothing, is the whole story right now. $Ethereum has the buyers. What it does not yet have is the follow-through. Below is the macro picture and the technical picture, and where the two collide.
What Happened to the Ethereum Price This Week?
The trigger was the August US Consumer Price Index, released on 11 September. Headline inflation came in at 3.4% year over year, matching expectations, while core CPI rose 0.3% month over month, slightly hotter than forecast. On paper that is a mildly hawkish print. Crypto rallied anyway.
The reason is positioning, not economics. Traders had been leaning short into the data, and the move detonated them. Roughly $665 million in crypto positions were liquidated across the market in 24 hours, with about $400 million of that on the short side. Ethereum alone accounted for around $250 million, more than Bitcoin's roughly $170 million. Ali Martinez also flagged that ETH transfers above $1 million jumped 14% on the day, which points at large holders adding rather than retail chasing.
So the spike was real demand meeting thin liquidity above the range. The problem is what happened next: ETH closed the week near $2,619 and has since slid back under $2,500 before stabilising around $2,505. A breakout that cannot hold its breakout level is a test, not a trend.
Why Does the Fed Rate Hike Matter for the Ethereum Price?
Here is the part most ETH holders are underweighting. The Federal Reserve meets on 15 and 16 September, and the market is not debating the size of a cut. It is pricing a hike.
Futures and prediction markets have been assigning roughly 80% to 87% probability to a 25 basis point increase, which would lift the federal funds rate off the 3.50% to 3.75% range it has held all year. Goldman Sachs and J.P. Morgan have both moved their forecasts to include the hike. J.P. Morgan's team pointed at two drivers: energy costs kept elevated by ongoing supply disruption tied to the Iran conflict and the Strait of Hormuz, and investor doubt about the Fed's inflation credibility after it held in July. Separately, prediction markets put the odds of zero rate cuts across all of 2026 at above 90%.
For a duration-sensitive risk asset like ETH, that is a headwind, full stop. Higher policy rates and a 10-year Treasury yield hovering near 4.8% raise the opportunity cost of holding a non-yielding asset, and they compress the multiple the market is willing to pay for future growth.
The interesting wrinkle is that ETH rallied into this anyway. Goldman Sachs analyst Jonathan Shugar has argued that risk assets can still appreciate through a hiking move, which is one explanation for why institutional demand for ETH products has not flinched. Either the market has fully digested the hike and is looking past it, or it is about to get a reminder. Wednesday settles the argument.
Are Ethereum ETF Inflows Still Supporting ETH?
This is the strongest leg of the bull case, and it is not close.
Spot Ethereum ETFs absorbed $216.41 million on 11 September alone, according to SoSoValue data, with BlackRock's ETHA taking $148.8 million of that, its biggest single day since January. Combined trading volume across ETH ETF products topped $2.56 billion, nearly matching Bitcoin's $2.6 billion. Ethereum was the only major crypto fund category to record net inflows that day. Bitcoin and Solana products both saw money leave.
Zoom out and the divergence gets sharper. Ethereum spot ETFs sit at roughly $863 million in net inflows for 2026, while Bitcoin spot ETFs are around $1 billion net negative on the year. ETH also outperformed BTC on price from 11 August to 10 September, gaining about 33% against Bitcoin's 23%.
There is a corporate bid underneath it too. Bitmine, chaired by Fundstrat's Tom Lee, had accumulated roughly 5.9 million ETH by September, around 4.9% of circulating supply, with most of it staked. Lee has been publicly calling for what he describes as a face-ripper rally for short sellers. Treat the commentary as talking a book, but the accumulation itself is a genuine supply constraint.
What Does the Ethereum Technical Analysis Show on the 3-Hour Chart?
The 3-hour chart is unusually clean right now.
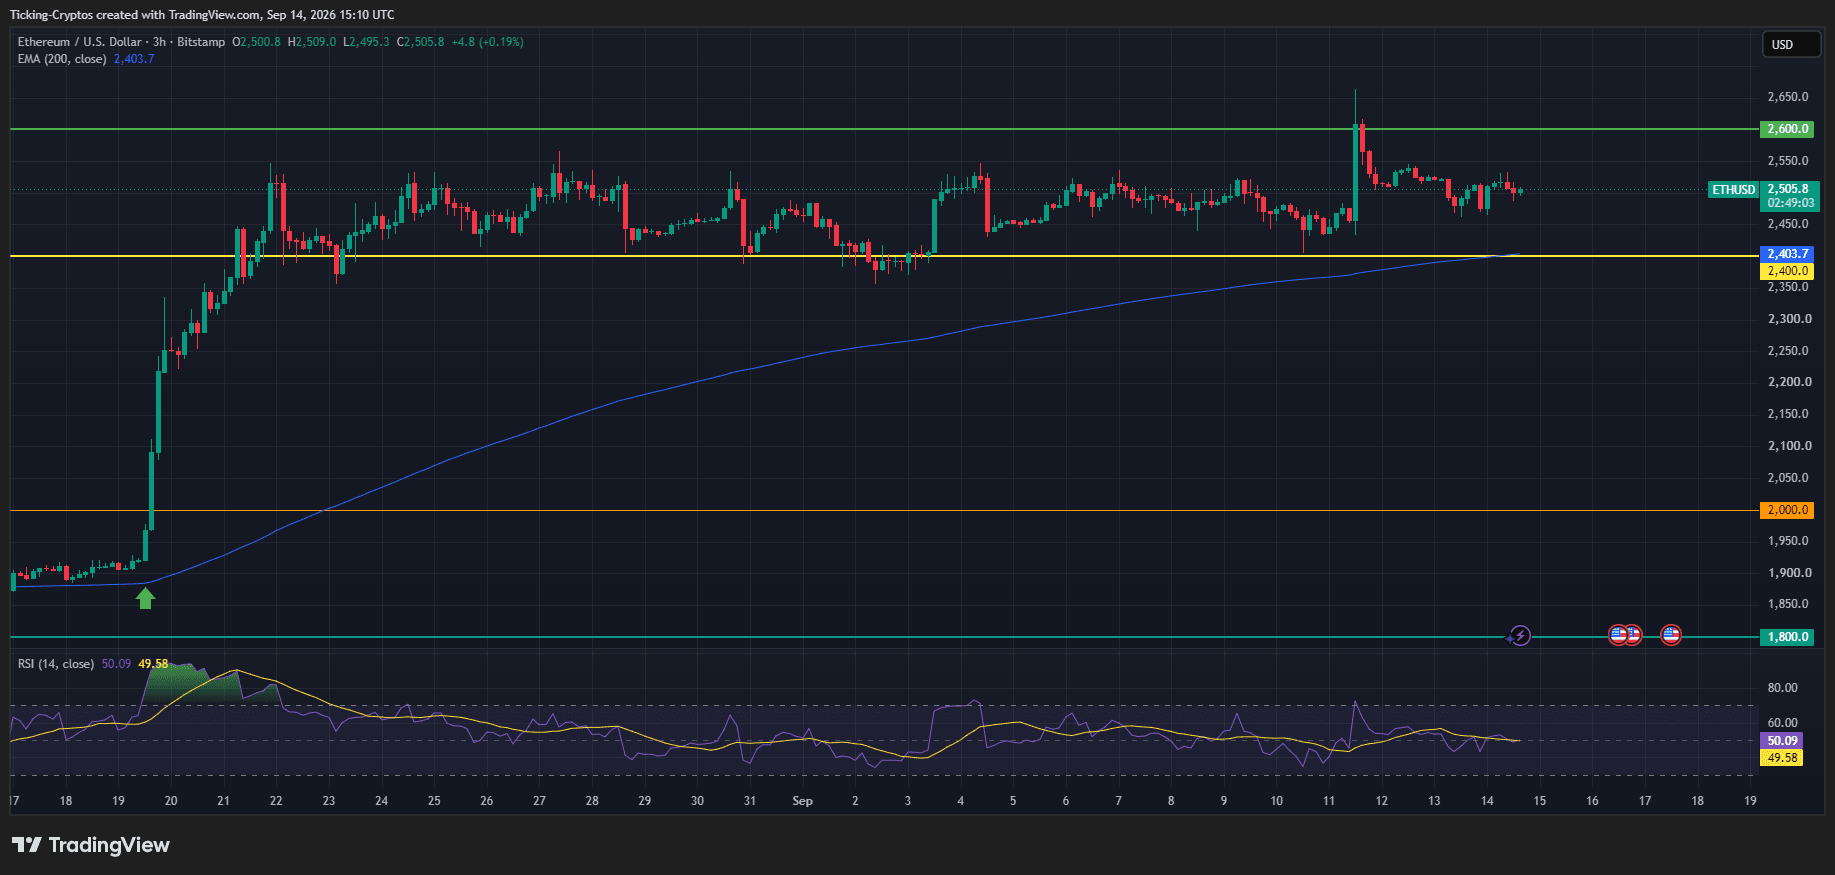
- The 200 EMA has caught up to price. The 200-period EMA sits at $2,403.7, and it has spent the last four weeks grinding higher from the $1,900 area while price went sideways. It has now converged almost exactly with the horizontal $2,400 level. When a moving average and a historical horizontal stack on top of each other, that level stops being a line and becomes a decision point.
- The breakout base is intact. The green arrow on the chart marks the 19 August ignition around $1,870. ETH added more than 30% in roughly 48 hours, clearing the descending trendline that had capped every rally since the August 2025 peak near $4,958. Everything since has been consolidation above that breakout, not a failure of it. Higher lows have held since the 3 September dip to the $2,370 zone.
- Momentum is flat, not weak. RSI (14) reads 50.09 with its signal line at 49.58. That is textbook neutral. The 11 September spike pushed RSI into the low 70s and it has since unwound back to the midline without price giving up the range, which is a healthy reset rather than a distribution signal. It also means neither side currently has an edge from momentum alone.
- The rejection candle matters. The 11 September wick to roughly $2,667 with a close back under $2,600 left a clear upper shadow. That is a supply print. Until ETH closes a candle above $2,600 and holds it, that wick is the ceiling.
Where Are the Key ETH Support and Resistance Levels?
Resistance:
- $2,550 is the immediate ceiling and the level analysts are watching for a weekly close. Clear it and $2,600 comes back into play quickly.
- $2,600 is the marked horizontal on the chart and the level that rejected on 11 September. It is the line that separates chop from trend.
- $2,700 to $2,800 is the real problem. Ali Martinez has pointed out that roughly 10 million ETH changed hands inside that band, creating a heavy supply wall. Every one of those holders is close to break-even, and break-even is where people sell. Clearing that zone is the precondition for any serious $3,000 conversation.
Support:
- $2,490 to $2,450 is the near-term shelf where the current range has been holding.
- $2,400 is the one that counts, because it is the horizontal and the 200 EMA together. Holding it keeps the August structure alive.
Below that, the chart offers very little until the $2,000 horizontal, with the next marked level all the way down at $1,800. That gap is thin air, which is exactly why $2,400 is worth defending.
What Is the Ethereum Price Outlook From Here?
Three scenarios, in rough order of probability as the chart currently sits.
- Range continuation (most likely near term). ETH keeps chopping between roughly $2,450 and $2,600 through the Fed decision. RSI at 50 and fading volume since the breakout both argue for this. Boring, but it is what consolidation above a breakout usually looks like.
- Bullish resolution. A daily or weekly close above $2,550, ideally confirmed by another heavy ETF inflow day, opens $2,600 and then the $2,700 to $2,800 supply wall. Getting through that band on volume is what would put $3,000 on the table. The ETF bid and the Bitmine accumulation are the fuel for this path.
- Bearish resolution. A close below $2,400 breaks both the horizontal and the 200 EMA in one move, which would invalidate the higher-low structure built since 3 September. A hawkish Fed surprise on 16 September, a hike plus language pointing at more, is the obvious catalyst. The measured downside from there runs toward the $2,220 area where the 50-day EMA sits, with little structural support before $2,000.
One more calendar item worth keeping on the radar: the Glamsterdam upgrade has slipped to Q4 2026, with the Sepolia testnet fork scheduled for 28 September and developers cautioning that the date can still move. It is not a this-week catalyst, but a confirmed testnet fork would give bulls a narrative to work with heading into October.
The short version: Ethereum has the institutional bid, the broken trendline and the higher lows. What it does not have is a close above $2,600 or a Fed that wants to help. Watch $2,400 and watch Wednesday.
0
0

 Beheer al jouw cryptovaluta, NFT en DeFi vanaf één plek
Verbind de portfolio die je gebruikt veilig om te beginnen.


