
Chainlink Price Prediction: LINK Breakout Eyes $10.87

0
0

This Chainlink price prediction comes at a notable moment for the project, with a fresh institutional integration headline landing alongside a technical setup that traders have been tracking closely.
LINK recently broke out of a multi-day consolidation pattern, and the question now is whether that move can extend further.
This is not financial advice. The levels discussed below are drawn from a 1-hour LINK/USDT perpetual chart on Bybit, reflecting a short-term, intraday to multi-day view rather than a long-term forecast.
LINK Market Snapshot Today
Chainlink (LINK) is trading at $9.569, up 1.41% on the day.
Futures volume over the past 24 hours stands at $452.01M against spot volume of $60.04M, indicating that leveraged futures trading currently accounts for the larger share of activity.
Open interest, meaning the total value of all open futures and perpetual contracts that have not yet been settled, sits at $683.90M.
Market cap is $7.17B against a circulating supply of 748.09M LINK, out of a fixed total and max supply of 1.00B. (See also: LINK open interest and volume trends.)
Source: CoinGlass, August 19, 2026.
Methodology and Data Sources for This Chainlink Price Prediction
This Chainlink price outlook is built from a 1-hour LINK/USDT perpetual chart on Bybit, viewed through TradingView.
The symmetrical triangle and its breakout, marked directly on that chart, form the basis of the technical read below.
Price, volume, open interest, liquidation, and holder concentration figures are sourced separately, each cited individually with its own date.
The forecast horizon here is short-term, generally the next few hours to a few trading days, and should be reassessed if the price closes meaningfully beyond the range discussed.
Wyoming Moves FRNT Stablecoin to Chainlink CCIP
A fresh integration headline adds institutional weight to this LINK technical analysis.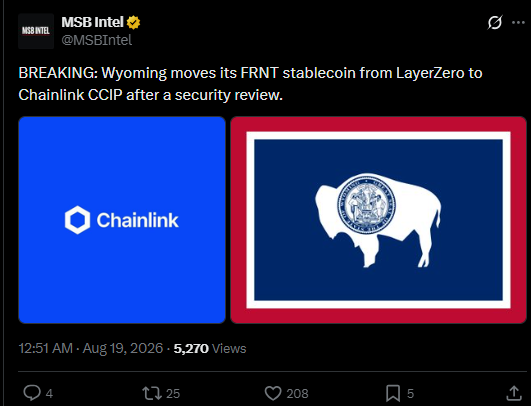
Wyoming has moved its FRNT stablecoin from LayerZero to Chainlink's Cross-Chain Interoperability Protocol, known as CCIP, following a security review.
CCIP is Chainlink's infrastructure for securely transferring data and tokens between different blockchains.
A state-level stablecoin choosing Chainlink's cross-chain infrastructure after a security review signals growing institutional confidence in the protocol, though it is a longer-term adoption signal rather than a short-term price catalyst.
Source: @MSBIntel on X, August 19, 2026, 12:51 AM.
LINK Liquidation Data Today
Liquidation activity shows short-side positions absorbing most of the pressure across nearly every timeframe.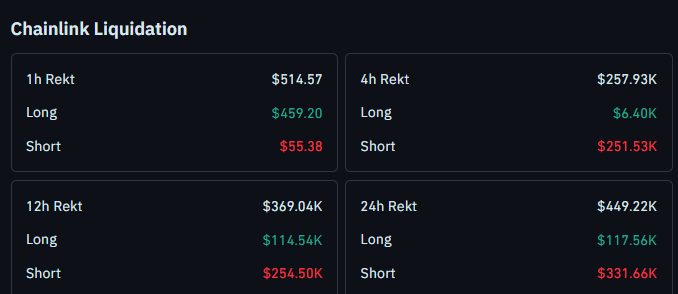
Over the past hour, total liquidations were light at $514.57, with $459.20 in long-side liquidations against $55.38 in short-side liquidations, a brief exception to the broader pattern.
Over four hours, short-side liquidations jumped to $251.53K out of $257.93K total, with only $6.40K on the long side.
The 12-hour window shows $254.50K in short-side liquidations against $114.54K in long-side liquidations, out of $369.04K total.
Over 24 hours, short-side liquidations remain dominant at $331.66K against $117.56K in long-side liquidations, out of a total $449.22K.
This pattern of repeated short-side liquidation over four-, twelve-, and twenty-four-hour windows is consistent with the recent breakout catching short positions offside. (See also: Chainlink liquidation heatmap analysis.)
Source: CoinGlass, Chainlink liquidation data, August 19, 2026.
LINK Holder Distribution and Concentration
On-chain holder analytics add useful context on supply concentration.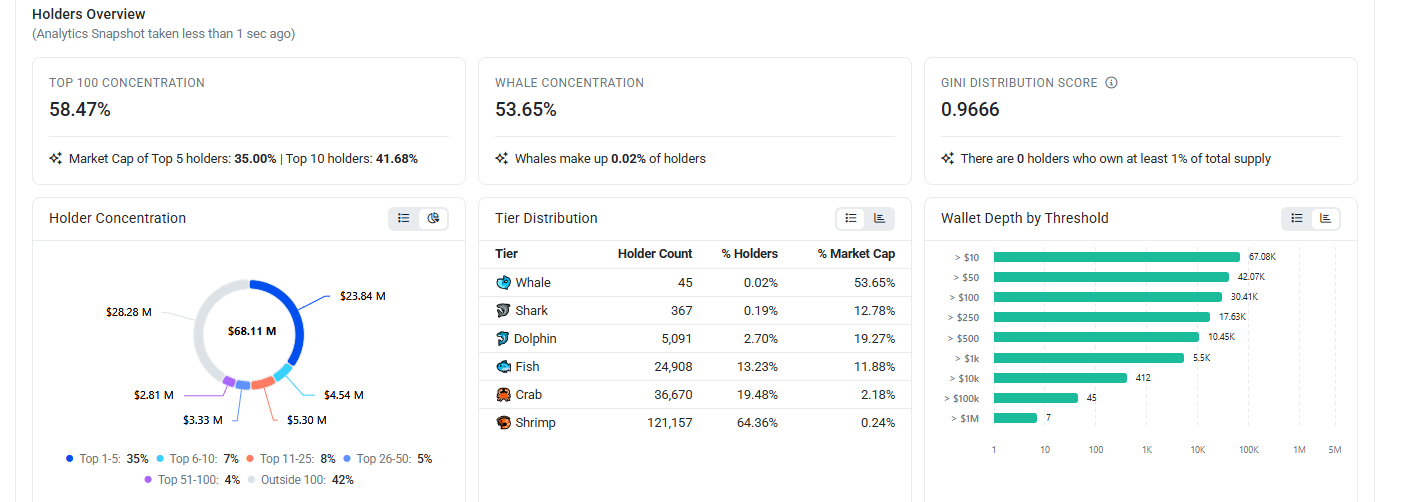
The top 100 wallets hold 58.47% of supply, and wallets classified as whales, defined here as the largest 0.02% of holders, control 53.65% of market cap.
The top 5 holders alone account for 35.00% of market cap, and the top 10 account for 41.68%.
The Gini distribution score, a measure of supply inequality where a value closer to 1 indicates higher concentration, stands at 0.9666.
By tier, 121,157 wallets classified as shrimp hold just 0.24% of market cap collectively, while only 45 whale wallets control the majority share.
Notably, no single holder owns 1% or more of total supply, which limits the risk of one wallet's activity moving the market on its own even though concentration among the top tiers remains high. (See also: LINK whale holder concentration report.)
Source: on-chain holder analytics, August 19, 2026.
LINK Price Right Now and Key Levels to Watch
CMP: $9.568 (Bybit LINK/USDT perpetual, 1h chart)
24h Change: +1.41% (per CoinGlass)
Confirmed breakout base: symmetrical triangle, already broken to the upside
Upside trigger levels: 9.752, then 10.044, then 10.873 (major resistance)
Downside invalidation: close below 9.289
Next support if breakout fails: 8.925
Data captured: August 19, 2026, approximately 11:43 AM IST (6:13 AM UTC)
A brief risk note before the details: short-side liquidations have outpaced long-side liquidations across every recent window on LINK, which points to leveraged positioning that can reverse quickly if momentum stalls, so treat the levels below as reference points rather than guarantees.
Chainlink Price Prediction: 1-Hour Chart Analysis
Price recently completed a breakout from a symmetrical triangle pattern on the 1-hour chart and has been grinding higher at a measured pace since.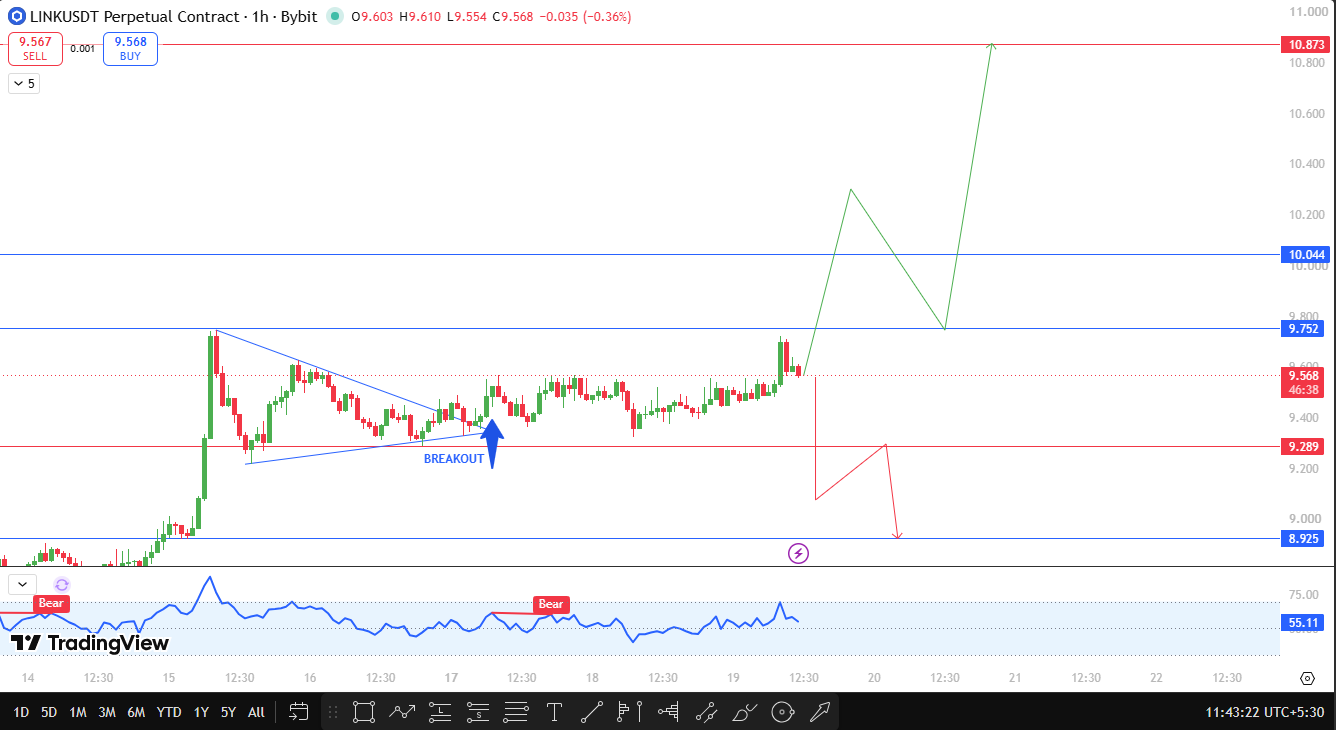
A symmetrical triangle forms when price compresses between converging support and resistance trendlines, and a confirmed break from that pattern often signals the start of a new directional move.
The chart's momentum indicator is currently reading 55.11, a mid-range level that leans mildly bullish without being overextended.
Two earlier bearish divergence tags appeared on the indicator before the triangle breakout, but momentum has since firmed up alongside the price move.
If price breaks and closes above 9.752 and sustains above that level, the next resistance comes in at 10.044, followed by 10.873 as the major resistance zone for this setup.
If instead LINK breaks and closes below 9.289, the breakout would be considered failed, opening the door toward 8.925 as the next support.
LINK Technical Outlook Snapshot
Indicator | Signal |
Trend structure | Symmetrical triangle breakout, confirmed and holding |
Current position | Grinding higher, testing resistance near 9.752 |
Momentum reading | 55.11, mid-range and mildly bullish |
Bias above 9.752 | Bullish continuation toward 10.044 and 10.873 |
Bias below 9.289 close | Breakout failure, bearish shift toward 8.925 |
LINK Support and Resistance Levels to Watch
Type | Level | Note | % From CMP |
Resistance 3 | 10.873 | Major resistance zone | +13.64% |
Resistance 2 | 10.044 | Second resistance on breakout | +4.97% |
Resistance 1 | 9.752 | Immediate resistance to clear and hold | +1.92% |
Breakdown Confirmation | 9.289 | Close below signals breakout failure. | -2.92% |
Support 1 | 8.925 | Next support if breakout fails | -6.72% |
LINK Risk-Reward Table
Case | Trigger | Target |
Bull Case | Close and sustain above 9.752. | 10.044, then 10.873 |
Bear Case | Close below 9.289, breakout fails. | 8.925 |
Invalidation Level: The bullish structure is invalidated on a confirmed close below 9.289, which would signal the triangle breakout has failed and shift focus to 8.925.
What Would Change This Chainlink Price Prediction?
A confirmed close and sustained hold above 9.752 followed by a push through 10.044 would reinforce the bullish case and bring 10.873 into view. Conversely, a close below 9.289, particularly if paired with a rise in long-side liquidations similar to the pattern seen in the past hour, would support the case for a failed breakout.
How Bitcoin Sentiment Could Move LINK
LINK generally moves in step with broader crypto market sentiment, and Bitcoin's direction often influences how much risk appetite exists for altcoin breakouts like this one.
A steady or strengthening Bitcoin tends to support continuation setups such as LINK's current triangle breakout, while renewed Bitcoin weakness could pressure LINK even before its own key levels are tested.
When This Chainlink Price Prediction Gets Revisited
This setup will be revisited if price closes decisively above 10.044 or below 9.289 within the next 24 hours, since either close would confirm the next directional phase.
Absent a confirmed close in either direction, the 9.752 resistance and 9.289 support levels remain the ones to watch.
Glossary
CMP: Current Market Price, the live trading price at the time of writing.
Open Interest: The total value of all outstanding futures or perpetual contracts that have not been closed or settled.
Liquidation: The forced closing of a leveraged position when losses erode the trader's margin below the required maintenance level.
Symmetrical Triangle: A chart pattern formed by converging support and resistance trendlines, typically resolved by a breakout in either direction.
CCIP: Chainlink's Cross-Chain Interoperability Protocol, used to securely transfer data and tokens between blockchains.
Gini Distribution Score: A measure of supply concentration among holders, where values closer to 1 indicate higher inequality.
Bull, Base, and Bear Case for LINK
Bull Case: Price closes and sustains above 9.752, confirming breakout continuation, and extends toward 10.044 and eventually the major resistance at 10.873.
Base Case: Price consolidates between 9.289 and 9.752, digesting the recent triangle breakout without a decisive close in either direction.
Bear Case: Price closes below 9.289, signaling the breakout has failed, and drifts toward 8.925 as the next support.
Disclaimer
This article is for informational purposes only and does not constitute financial advice. Cryptocurrency markets, including perpetual futures, are highly volatile, and leveraged trading carries significant risk of loss. CoinGabbar and the analyst do not hold a position at the time of publication. Readers should conduct their own research before making any investment decisions.
0
0

 Կառավարեք ձեր բոլոր կրիպտարժույթները, NFT-ն և DeFi-ն՝ մեկ տեղից
Ապահովաբար կցեք ձեր օգտագործած պորտֆոլիոն՝ սկսելու համար:

0
0

0
0

0
0

0
0