
Unicorn Price Prediction: $UWU Coin Surges Inside Falling Channel

0
0

Something is happening with UwU right now, and searches for unicorn price prediction are suddenly spiking as traders who normally scroll straight past this little Solana meme token stop to look twice. A single day can flip the mood entirely in this corner of the market, and today looks like one of those days, the same way it has for other names covered in our latest price prediction coverage. Behind the excitement, though, sits a chart structure that has burned plenty of buyers before, stubborn enough to make even seasoned traders pause before calling this a real turnaround. Is this the moment it finally breaks free, or just another tease before the same old resistance takes over again? We looked past the noise and the hype threads and went straight to the chart to see what is actually going on beneath the surface of this sudden move.
$UWU Price Prediction: Why This Solana Meme Coin Is Back In Focus
Something about $UWU price prediction today has stopped scrollers mid-swipe.
Meme coins on Solana move fast, but this one has a habit of teasing traders before pulling back just as things start looking good, a pattern that shows up across top memecoins today more than people admit.
Today felt different, at least at first glance, pulling attention back to a token plenty of people had quietly stopped watching, right as the wider Solana ecosystem price action started turning heads too.
Liquidity is thin here, attention spans are thinner, and one strong session can flip sentiment overnight. That combination is exactly why this coin keeps resurfacing in trader group chats every few weeks.
But is it different, actually different this time, or just another familiar setup dressed up in new candles? Turns out the answer depends on which timeframe you trust, and that tension is exactly what is driving today's conversation around this coin.
So what happens next for a token that keeps promising a breakout and keeps falling just short of delivering one? Let's get into it.
What's Actually Going On
$UWU trades on PumpSwap, on Solana, under the ticker Unicorn. Cute branding. Real chart.
Back in June it ripped hard off a tiny base, multiplied several times over, and then rolled straight into a downtrend that hasn't fully let go. That downtrend now looks like a descending channel on the daily chart. Lower highs. Lower lows. Until today.
Quick hits before we go deep:
-
Short-term momentum flipped positive, but price is still boxed inside a channel that's rejected every prior bounce since early July.
-
Buy volume beat sell volume by more than two to one over the past day. And yet more individual wallets sold than bought. Someone big was buying.
-
The range to watch: roughly $0.0215 on the low end, up toward $0.0404 on the high end, with the channel's upper rail sitting near $0.032 to $0.034.
-
If price closes back under the rising support line near $0.026, the bounce story is basically dead.
Coin Overview, Fast
$UWU is a Solana meme token, part of a much bigger meme coin sector that keeps pulling in speculative money. No product, no roadmap in the traditional sense, just a running joke about "unicorn" valuation milestones: Minicorn, Soonicorn, Unicorn, Decacorn, and the fantasy tier, Hectocorn, at 100 billion dollars.
Per the DexScreener market data we pulled, $UWU last traded around $0.03177, or 0.0004159 SOL. Market cap sits near $31.7 million. Fully diluted value is basically the same number, which means there's no giant hidden supply about to unlock and dump on holders. That part's clean.
Contract address: $UWUy7J86LUiBv5SjAUZ53LMGhtnqvbQ7QNSSkyupump. Worth pasting that into your wallet or explorer of choice before you trade anything, since names like this get copied constantly.
Liquidity, though? Just $433K. That's thin.
And thin liquidity means every candle, up or down, moves harder than it should. That's worth keeping in mind next to the broader crypto exchange landscape, where deeper pairs behave very differently.
One more thing worth flagging. Names like $UWU and Unicorn get recycled constantly on Solana. There are other tokens out there sharing this ticker with completely different prices and contracts. Everything in this piece is tied to the specific PumpSwap pair shown in the charts we were given. Always check the contract address yourself before you touch any of these.
The Move, Hour by Hour
Here's the tape, straight from the charts.
Daily candle: opened at $0.02649, hit a high of $0.03203, dipped to $0.02540, and closed right at that high, $0.03203. Call it a plus 21 % day.
The DexScreener panel shows a bigger 24-hour number, plus 38.85%. Different rolling windows, probably. Either way, same conclusion: this was a strong session.
Now the order flow. 904 total trades. 575 buys, 329 sells. Buy volume: $54K. Sell volume: $22K.
More than double on the buy side.
But flip to the wallet count, and the story gets weirder. Only 77 unique buyers. 98 unique sellers. More people sold than bought, and the price still ripped.
Turns out that only happens one way: a handful of buyers went big while everyone else nibbled or sold into it. Not exactly the picture of broad conviction.
Zoom out to six hours, and the gain was plus 11.63%, meaning most of today's move already happened earlier in the session. Zoom in to five minutes, and it's actually down 0.19% right now.
Cooling off. Live and in real time.
Technical Analsysis: Reading the Chart
Daily chart first. $UWU has spent the second half of July grinding higher inside a channel that's sloping down overall. Lower rail near $0.026. Upper rail somewhere between $0.034 and $0.040 depending on where you draw it.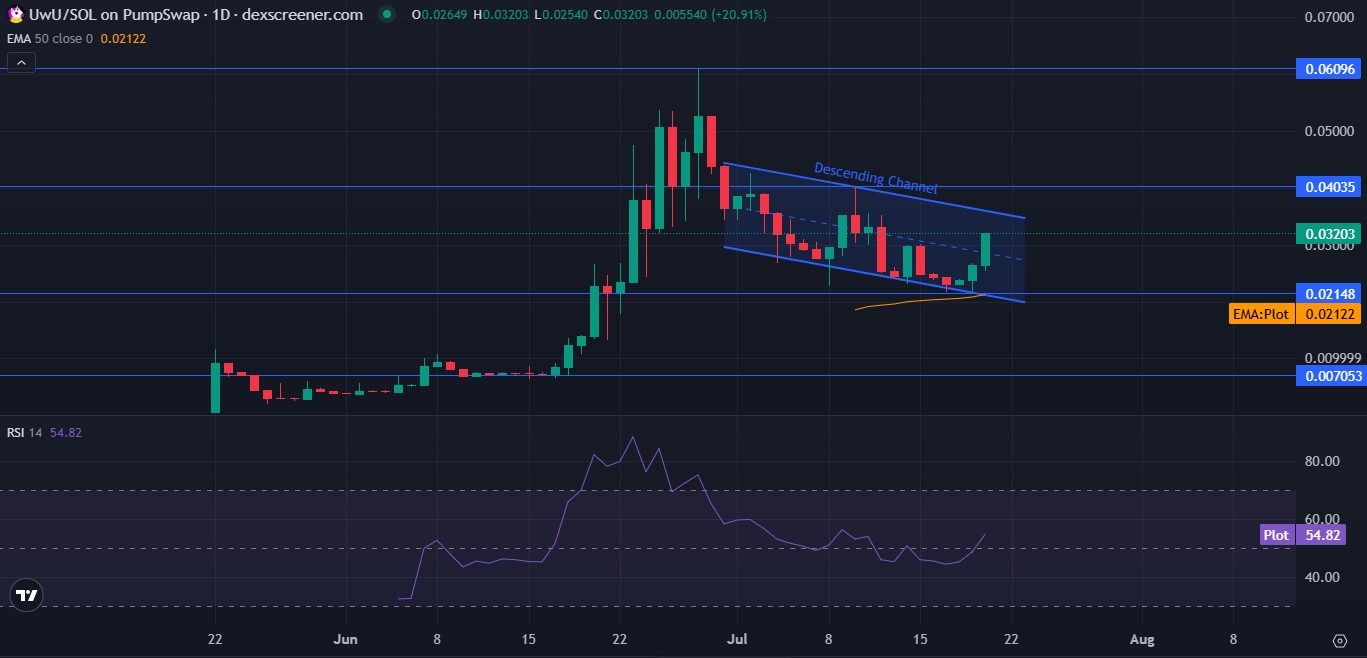
Today's candle pushed straight up into that upper rail. It didn't close above it.
And until it does, the bigger downtrend from early July's highs near five cents is still technically alive.
RSI, that's Relative Strength Index, a momentum gauge that flags overheated conditions above 70 and oversold ones below 30, sits at 54.82 right now. Dead neutral. Nowhere close to the mid-80s reading it hit back in June's initial spike.
The 50-day EMA, or exponential moving average, a smoothed average price line that reacts faster to recent moves than a simple average, sits around $0.0212. The price is holding above it. That part's mildly bullish, at least on paper.
The weekly chart tells a calmer, more constructive story.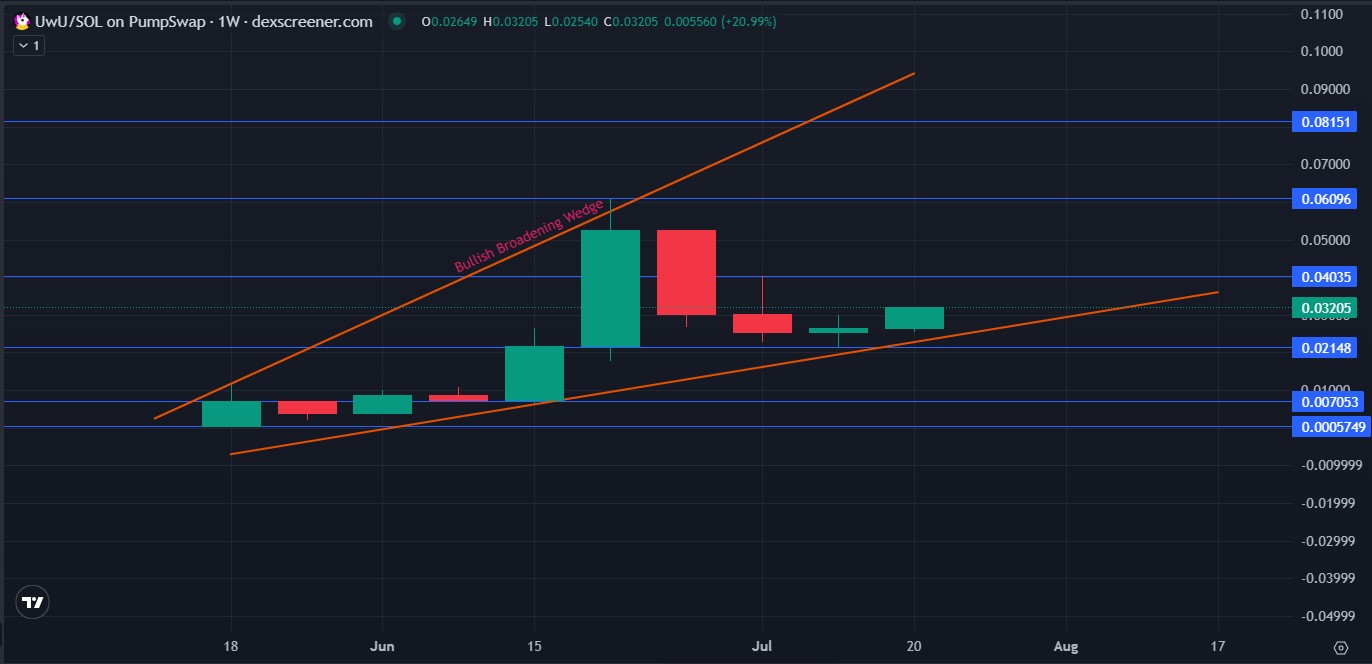
Zoomed out, $UWU's been climbing a broadening pattern off its original launch price near $0.0006, printing higher lows the whole way even as the range between support and resistance keeps stretching wider. Levels worth watching from here: $0.02148 and $0.007053 underneath, $0.04035 and $0.06096 above, if this base actually holds.
It's worth checking this against the Solana price outlook too, since $UWU trades on Solana and tends to follow the network's own mood swings.
So which chart wins? The daily one says caution. The weekly one says patience.
Both can be true at the same time. Actually, let's be more precise about this: the daily chart is the one that matters for anyone trading this week, and it hasn't given the green light yet.
Liquidity Check
$433K in liquidity against a $31.7 million market cap. That gap is the whole risk profile in one sentence.
Thin pools amplify everything. Pumps hit harder. Dumps hit harder. Slippage on any decent-sized trade gets ugly fast.
And the buyer-seller mismatch we flagged earlier fits right into that picture. Small liquidity plus a few oversized buy orders equals exactly the kind of candle we saw today. It doesn't confirm a trend change on its own.
Anyone digging deeper should pull up the $UWU holder distribution directly, since concentration among a few wallets can flip this setup fast.
Scenarios, Broken Down
| Timeframe | Bull Case | Base Case | Bear Case |
|---|---|---|---|
| Short-term (days) | A daily close above $0.034 confirms the channel finally breaks. Opens room toward $0.040 | Chops between $0.026 and $0.034 while the channel holds | Rejects again at resistance, slides back to the $0.0215 shelf |
| Weekly | A weekly close above $0.040 flips short-term structure bullish | Stays range-bound, $0.021 to $0.040 | Breaks $0.0215, retests the $0.007 zone |
| Monthly | Volume sustains, price pushes toward the $0.061 weekly level | Sideways drift while the broadening pattern keeps building | Liquidity thins more, price grinds back toward old lows |
| Long-term (speculative) | The broadening pattern resolves upward; path opens toward $0.08 plus | Range-bound as speculative interest ebbs and flows | Liquidity dries up, token fades toward its earlier lows |
But that bottom row deserves a caveat.
This is a young meme token without earnings, usage data, or protocol activity to anchor a real thesis. Long-term numbers here are chart geometry, not prophecy. Treat them as a map, not a promise.
Fast Take: What We'd Watch Right Now
Price is at the top of the channel. Right now.
A close above $0.034 changes the story completely.
A close below $0.026 kills the bounce narrative outright.
Everything in between is just noise, and noise is what thin-liquidity meme tokens do best.
Risks Worth Naming
Thin liquidity tops the list. A $433K pool means one large trade in either direction moves this thing hard, and pulled liquidity is a real, constant risk on PumpSwap listings.
Order flow imbalance is next. More sellers than buyers during an up day is not a healthy pattern, and if the bigger buyers step back, distribution could pick right back up.
And then there's the naming problem. $UWU and Unicorn branding gets reused across Solana constantly. Prices and liquidity swing wildly between them. Verify the contract before you do anything.
One last thing. Moves like this rarely happen in a vacuum, and it's worth glancing at the broader altcoin market and the Bitcoin price outlook before sizing anything here, since risk appetite tends to trickle down from the majors.
How We Got These Numbers
Chart levels came from the daily and weekly views of $UWU/SOL, using the visible 50-day EMA, RSI (14), and the marked channel and broadening-pattern lines. Liquidity, market cap, FDV, transaction count, and volume numbers came from a DexScreener panel for the same pair, cross-checked against coin market data where available.
Everything here is timestamped July 20, 2026, a single snapshot in time. On a token like this, that snapshot can look outdated within minutes. It's also worth tracking against the crypto market rally drivers moving risk assets more broadly today.
Disclaimer: This is market commentary based on chart patterns and one data pull, not investment advice. Meme tokens on thin liquidity pools can lose most or all of their value fast. Check contract addresses. Do your own research before you trade.
0
0


 Կառավարեք ձեր բոլոր կրիպտարժույթները, NFT-ն և DeFi-ն՝ մեկ տեղից
Ապահովաբար կցեք ձեր օգտագործած պորտֆոլիոն՝ սկսելու համար:


