Memecoin price prediction 2024 – 2030: Is MEME a wise investment?

0
0

Key takeaways
- By 2024, the Memecoin price prediction shows it could reach a maximum price of $0.01557.
- In 2027, the price of Memecoin is predicted to reach a maximum level of $0.0636.
- Memecoin is expected to cross a price level of $0.11 in 2030
Analyzing the recent price action, MEME’s price has fluctuated significantly over the past month, with notable resistance and support levels. The bearish trend has been consistent, but the increased trading volume could indicate the potential for a reversal. Despite the current market conditions, long-term projections remain bullish due to Memecoin’s fundamental potential and market positioning.
Overview
| Cryptocurrency | Memecoin |
| Token | MEME |
| Price | $0.01448 |
| Market Cap | $316,430,014 |
| Trading Volume | $72,401,475 |
| Circulating Supply | 21,845,809,577 |
| All-time High | $0.05706 Mar 03, 2024 |
| All-time Low | $0.01706 Nov 07, 2023 |
| 24-h High | $0.01487 |
| 24-h Low | $0.01395 |
Memecoin price prediction: Technical analysis
| Metric | Value |
| Price Prediction | $ 0.047395 (230.64%) |
| Volatility | 15.42% |
| 50-Day SMA | $0.022907 |
| 14-Day RSI | 33.79 |
| Sentiment | Bearish |
| Fear & Greed Index | 27 (Fear) |
| Green Days | 13/30 (43%) |
| 200-Day SMA | $0.028736 |
Memecoin price analysis: MEME hovers above $0.010 amidst market stagnation
Memeoicn (MEME) price analysis for August 18th shows the MEME token has been resilient above the crucial $0.010 level. The meme coin market has experienced stagnation over the past two months following an initial surge earlier this year. Despite a strong start, the market was soon inundated with numerous copycat meme coins lacking real utility, often resulting in pump-and-dump schemes. Recently, the focus shifted from the Solana (SOL) network, where meme coins had gained significant traction, to the Tron (TRX) network, which is now seeing new meme coin launches.

The price fluctuated between $0.009799 and $0.0101, reflecting a volatile but bullish trend. After dipping to the support level of $0.0077, the price rebounded, pushing toward the resistance level of $0.0101. This upward momentum suggests that MemeCoin could break past its resistance if buying pressure continues.
The immediate support level for MemeCoin is $0.00970, with a key resistance level of $0.01112. On the downside, a break below $0.0101 could lead to further declines.
MEME/USDT 24-hour chart analysis: Memecoin exhibits a bearish trend with low volatility
MemeCoin’s 1-day price chart reveals a gradual shift in market sentiment as the price attempts to recover from a prolonged downtrend. The current price of $0.01011 marks a significant bounce from the recent low of $0.00970. The MEME/USDT chart on the daily timeframe shows a consistent downtrend as the price has been moving below the Keltner Channel’s middle line, which acts as a dynamic resistance level.
Despite occasional attempts to break above the channel, MEME has been unable to sustain upward momentum. The Keltner Channel indicates resistance levels at $0.01151 and $0.01354 while the price hovers around $0.01009. Volume activity remains relatively low, indicating weak buying interest, which supports the bearish outlook.

The Relative Strength Index (RSI) stands at 36.30, close to the oversold territory, reflecting bearish sentiment. The RSI has been hovering below the 50 mark, suggesting that the downward momentum might continue. The slight uptick in the RSI from 33.84 could indicate a potential short-term rebound, but the overall trend remains bearish unless MEME breaks above the resistance levels with significant volume. Traders should watch for a potential reversal signal if the RSI climbs above 50 or if there is a break above the Keltner Channel’s upper band.
MEME Coin Shows Signs of Potential Reversal on 4-Hour Chart
The 4-hour chart for MEME/USDT reveals a prolonged downtrend, with the price steadily declining since late July. However, there are early signs of a potential reversal. The MACD indicator shows a bullish crossover, as the MACD line (blue) has crossed above the signal line (orange). This suggests that bearish momentum is weakening, and buyers might be gaining some control. The histogram is also turning positive, reinforcing the likelihood of a short-term upward move.

MEME/USDT 4-hour chart: TradingView
Despite the potential bullish crossover, the overall trend remains bearish, and caution is advised. The price is still below critical resistance levels, and without a significant increase in buying volume, this could be a false signal. Traders should closely monitor the MACD’s performance and look for confirmation, such as a break above the $0.01532 resistance level. If the price fails to maintain the momentum, MEME might continue to trade within the current range or resume its downtrend.
What to Expect From MEME Coin Price Analysis
The MEME coin has shown promising signs of resilience and potential growth amidst a fluctuating cryptocurrency market. The recent technical analyses from daily and 4-hour charts signal a budding bullish trend, highlighted by improvements in key indicators. These indicators suggest that MEME might be preparing for a significant recovery as it moves away from oversold conditions and potentially towards a bullish crossover, indicating increasing momentum. Moreover, the influence of cryptocurrency whales, evident in substantial token movements, plays a crucial role in shaping MEME’s price trajectory and market sentiment.
Memecoin technical indicators: Levels and action
Daily simple moving average (SMA)
| Period | Value | Action |
| SMA 3 | $0.016007 | SELL |
| SMA 5 | $0.014828 | SELL |
| SMA 10 | $0.015986 | SELL |
| SMA 21 | $0.018319 | SELL |
| SMA 50 | $0.022907 | SELL |
| SMA 100 | $0.026173 | SELL |
| SMA 200 | $0.028736 | SELL |
Daily exponential moving average (EMA)
| Period | Value | Action |
| EMA 3 | $0.017768 | SELL |
| EMA 5 | $0.018397 | SELL |
| EMA 10 | $0.01913 | SELL |
| EMA 21 | $0.020717 | SELL |
| EMA 50 | $0.02364 | SELL |
| EMA 100 | $0.026273 | SELL |
| EMA 200 | $0.028119 | SELL |
What to expect for Memecoin
The Memecoin price analysis shows a potential bullish revival for the Memecoin price, between $0.01415 and $0.01495. The technical indicators also support this uptrend, with bullish crossovers and ascending triangle patterns. The bulls are gaining control of MEME coin prices, making it an exciting time for investors to watch this popular cryptocurrency’s performance in the market.
Is Memecoin a good investment?
Investing in MEME coin can be considered a strategic move for those looking to tap into the viral nature of meme-driven assets. These coins often see rapid appreciation or decrease in value driven by social media trends and community enthusiasm, which can lead to substantial short-term gains. The appeal of MEME coin lies in its potential to capitalize on the widespread attention and excitement surrounding viral tokens, making it an attractive option for investors adept at navigating the volatile crypto market and timing their trades to optimize returns.
Will Memecoin recover?
Based on the chart and the recent upward movement, Memecoin shows signs of recovery. If this positive trend continues, Memecoin has the potential for further recovery.
Will Memecoin reach 10?
Reaching $10 for Memecoin is highly unlikely, given its current price levels and market trends.
Will Memecoin reach 100?
Reaching $100 for Memecoin is extremely improbable due to its current price levels and the enormous market capitalization required. Such a drastic increase in prices would necessitate unprecedented growth and adoption.
Does Memecoin have a good long-term future?
Based on data and the recent upward movement, Memecoin may have the potential for a good long-term future. Positive market trends, adoption, and development will be crucial for its sustained success.
Memecoin August price prediction 2024
According to Memecoin’s forecast and technical analysis, in August 2024, Memecoin is expected to trade at an average price of $0.01107, a minimum price of $0.0101, and a maximum price of $0.01112.
| Month | Potential Low | Potential Average | Potential High |
| August | $0.0101 | $0.01107 | $0.01112 |
Memecoin price prediction 2024
The Memecoin price is predicted to trade at a minimum value of $0.0101, a maximum value of $0.01112, and an average forecast price of $0.01107 in Q3 and Q4 of 2024.
| Year | Potential Low | Potential Average | Potential High |
| 2024 | $0.0101 | $0.01107 | $0.01112 |
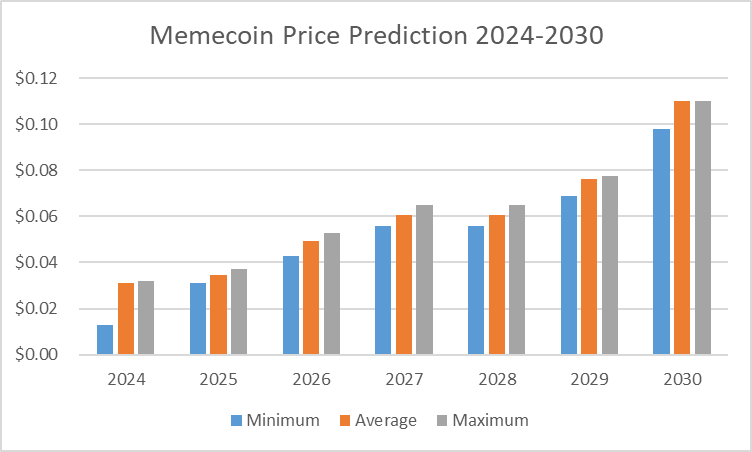
Memecoin price prediction 2025-2030
| Year | Minimum | Average | Maximum |
| 2025 | $0.0201 | $0.0223 | $0.0239 |
| 2026 | $0.0276 | $0.0320 | $0.0342 |
| 2027 | $0.0360 | $0.0392 | $0.0421 |
| 2028 | $0.0360 | $0.0392 | $0.0421 |
| 2029 | $0.0444 | $0.0492 | $0.0502 |
| 2030 | $0.0633 | $0.0690 | $0.0696 |
Memecoin price prediction 2025
The price of Memecoin is forecast to reach a lowest possible level of $0.0201 in 2025. The MEME price could reach a maximum possible level of $0.0239, with an average forecast price of $0.0223.
Memecoin price prediction 2026
The price of Memecoin is expected to reach a minimum level of $0.0276 in 2026. The MEME price can reach a maximum level of $0.0342 with the average price of $0.0320.
Memecoin price prediction 2027
In 2027, the price of Memecoin is predicted to reach a minimum level of $0.0360. The MEME price can reach a maximum level of $0.0421, with an average trading price of $0.0392.
Memecoin price prediction 2028
The price of Memecoin is predicted to reach a minimum level of $0.0544 in 2028. It can reach a maximum level of $0.0636, with an average price of $0.0592 throughout 2028.
Memecoin price prediction 2029
Memecoin is expected to exceed $0.0492 in 2029. Meanwhile, It is expected to reach a minimum price of $0.0444 this year. The maximum price may reach $0.0502.
Memecoin price prediction 2030
The price of Memecoin is forecast to reach its lowest possible level of $0.0633 in 2030. According to our findings, it could reach a maximum possible level of $0.0696, with an average forecast price of $0.0690.
Memecoin market price prediction: Analysts’ MEME price forecast
| Firm Name | 2024 | 2025 |
| Gov.Capital | $0.0157 | $0.03487 |
| DigitalCoinPrice | $0.0405 | $0.0631 |
| CoinCodex | $0.026647 | $0.04098 |
Memecoin price prediction by Cryptopolitan
According to Cryptopolitan, Memecoin Price Prediction, or MEME, will experience tremendous growth as it can achieve new highs in price points and market cap. Meanwhile, Memecoin is expected to reach a minimum price of $0.0185. The maximum price may reach $0.0211 in 2024.
Memecoin historic price sentiment
- Memecoin was launched on 28th October by the renowned internet humor platform 9GAG and has quickly become a significant player in the meme coin market.
- The Memecoin garnered immense popularity through a unique launch strategy involving a fire sale and strategic social media airdrops to cultivate a robust and dedicated community.
- This approach proved highly successful. The fire sale raised over $11 million and sold more than 11.4 billion MEME tokens at $0.001 each, representing a 150% surge from what the team initially planned.
- Looking at its price history since 27th October 2020, MEME saw its first price pump on the same day, reaching a high of $0.02868.
- The MEME token price remained above $0.0020 until 7 November, when a minor pullback occurred below the $0.0200 level.
- Memecoin continued trading around the $0.020 level, with minor fluctuations, until the price spiked again on 4 January, reaching an all-time high of $0.04075 on November 15th.
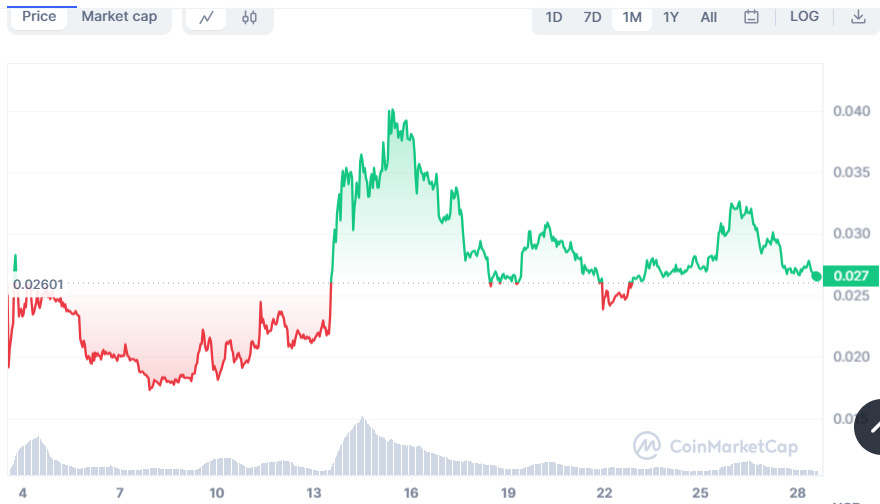
- Memecoin recorded an all-time low of $0.0751 on 14 January, following a significant market correction. This dip was short-lived, and the token’s price quickly rebounded. The meme coin has been trading at around $0.0268 for the past few days.
0
0


 Управляйте всей своей криптовалютой, NFT и DeFi из одного места
Безопасно подключите используемый вами портфель для начала.

0
0

0
0

0
0

0
0