
Cosmos Price Prediction: $ATOM Future Price, IMP Levels

0
0

$ATOM is climbing out of its range. Cosmos is doubling down on its multi-chain vision, with interoperability between independent blockchains framed as critical infrastructure for the wider Web3 economy.
This Cosmos Price Prediction looks at whether the $ATOM coin price can keep pushing toward $1.806 and beyond, with the move holding above $1.608, or fading back if buyers lose that level.
Market data was checked on September 8, 2026, at 14:20 IST.
Cosmos Price Prediction Today: Market Overview
Metric | Value |
Price | $1.660 |
24h Change | +2% |
Market Cap | $878.28M |
Unlocked Mkt Cap | $601.12M |
FDV | $876.64M |
24h Volume | $33.32M |
Vol/Mkt Cap (24h) | 3.8% |
Total Supply | 529.28M |
Max Supply | ∞ |
Circulating Supply | 529.28M |
Holders | 838K |
Source: Data from CoinMarketCap as of September 8, 2026, at 14:20 IST. Figures may vary slightly across other tracking websites.
ATOM Crypto News Today: Multi-Chain Interoperability in Focus
Cosmos's multi-chain future needs connectivity, according to a post from trader Akshay. 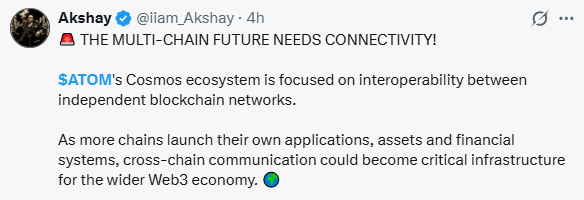
Source: Data From X
The Cosmos ecosystem is focused on interoperability between independent blockchain networks, and as more chains launch their own applications, assets, and financial systems, cross-chain communication could become critical infrastructure for the wider Web3 economy.
CoinGabbar could not independently verify the broader adoption claims in this post beyond what was shared.
ATOM Chart Analysis: Range Breakout and EMA Levels
Pair: ATOM/USDT · Market: Spot (Crypto) · Exchange: OKX · Timeframe: 1D · Source: TradingView · Timestamp: September 8, 2026, 05:50 UTC-3
ATOM is trading at $1.660, after pushing out of the tight range it had held since late August.
Price cleared both EMAs on the move and is now consolidating just above that level. The EMA readings sit at $1.529 for the 20-period and $1.511 for the 50-period, both now sitting below the current price and acting as support if the move gets retested.
The chart also marks a projected upside path toward the $2.300 zone, shown as a +43.22% move from current levels, though this is a chart annotation rather than a confirmed resistance test.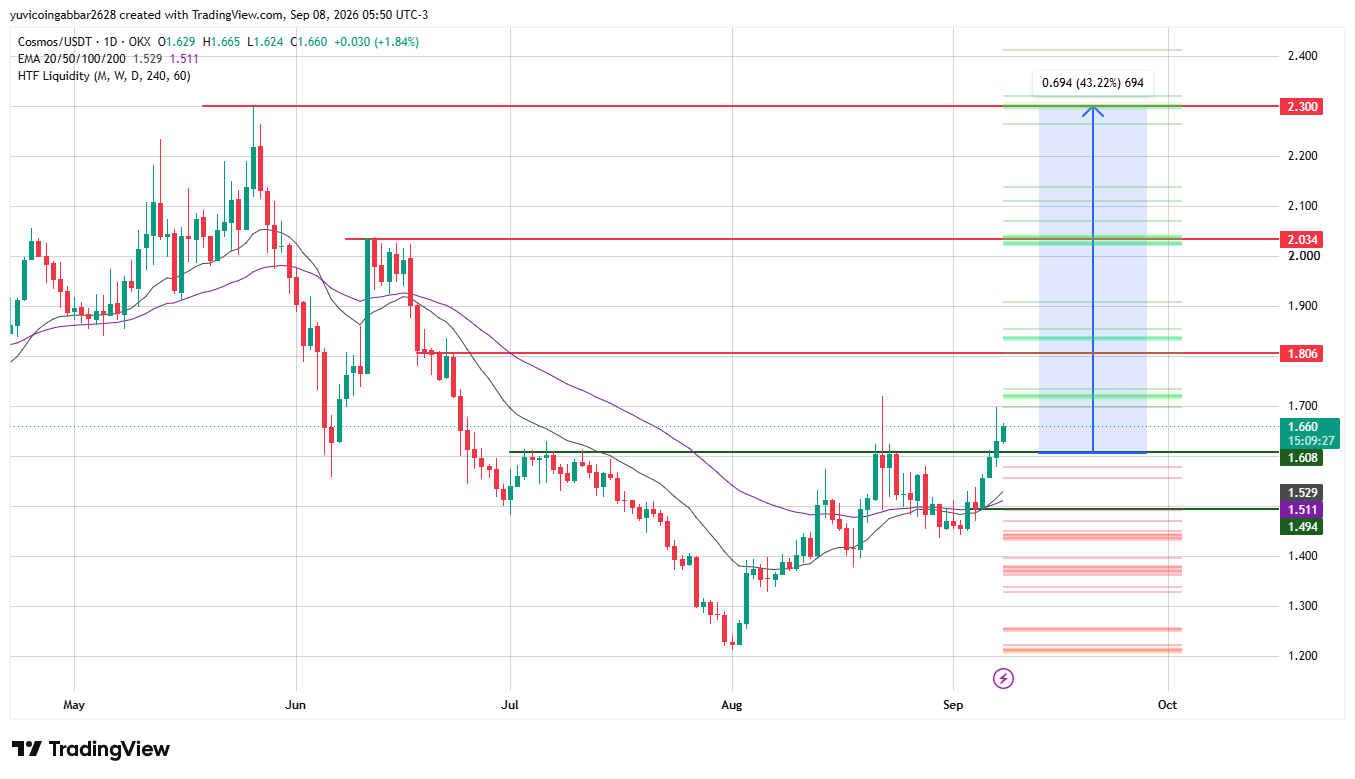
Cosmos Price Forecast and Outlook: Key Levels to Watch
Level Type | Price |
Resistance 3 | $2.300 |
Resistance 2 | $2.034 |
Resistance 1 (nearest) | $1.806 |
Immediate Price Reference | $1.660 |
First Confirmed Support | $1.608 |
Deeper Support | $1.494 |
ATOM Price Prediction: Bull Case vs Bear Case
Bull case: Holding above the first confirmed support at $1.608 keeps the breakout structure intact, opening a path toward $1.806 and then $2.034 if multi-chain narrative momentum and volume stay supportive.
Bear case: A close back below $1.608 would put the breakout in doubt, and a deeper break under the EMA cluster near $1.511 to $1.529 would expose $1.494 as the next downside target.
ATOM Price Scenarios: Triggers and Invalidation
Scenario | Trigger | Likely Outcome | Invalidation Point |
Trendline reclaim (bullish) | Hold above $1.608 | Move toward $1.806, then $2.034 | Close below $1.608 |
Channel hold | Range between $1.608 and $1.806 | Consolidation before next leg | Break of either bound |
Channel breakdown (bearish) | Close below EMA cluster ($1.511–$1.529) | Slide toward $1.494 | Reclaim of $1.608 |
Can ATOM Reach $2.300?
$2.300 is the highest resistance level marked on the chart, matching the projected move shown in the chart's upside annotation.
Reaching it would take a multi-stage move: clearing $1.806, then holding above $2.034, before a run at the $2.300 zone becomes realistic.
Cosmos Price Prediction: Expert View
According to CoinGabbar analysts, The range breakout and renewed focus on Cosmos's interoperability narrative give ATOM a constructive short-term setup.
Price has been holding above the EMA cluster since the recent push, suggesting buyers are defending the breakout so far.
$1.608 is the level that decides whether this move extends toward $1.806 and higher.
Cosmos Price Prediction: Data Sources
Price and EMA data referenced from a 1D ATOM/USDT chart via TradingView on OKX, timestamped September 8, 2026, 05:50 UTC-3. Market cap, FDV, volume, and supply data referenced from CoinGecko. News updates referenced from a post by Akshay on social media.
Disclaimer
This piece is for informational purposes only and isn't financial advice. The levels and scenarios above are based on technical chart analysis and publicly available data at the time of writing, and crypto markets can move sharply within hours, so past patterns don't guarantee future outcomes.
0
0


 Կառավարեք ձեր բոլոր կրիպտարժույթները, NFT-ն և DeFi-ն՝ մեկ տեղից
Ապահովաբար կցեք ձեր օգտագործած պորտֆոլիոն՝ սկսելու համար:


