
Constellation Energy Corporation stock nears $355 target before Q2 earnings

0
0
Constellation Energy Corporation stock sits at a genuine inflection point, caught between a sharp short-term recovery and a longer-term downtrend that has yet to resolve. Shares closed at $270.62 after a volatile $17.48 daily range, well off the session low of $262.49 but below the open of $278.44.
Key takeaways
- CEG closed at $270.62, trading inside a wide $17.48 daily range that signals elevated volatility around the name.
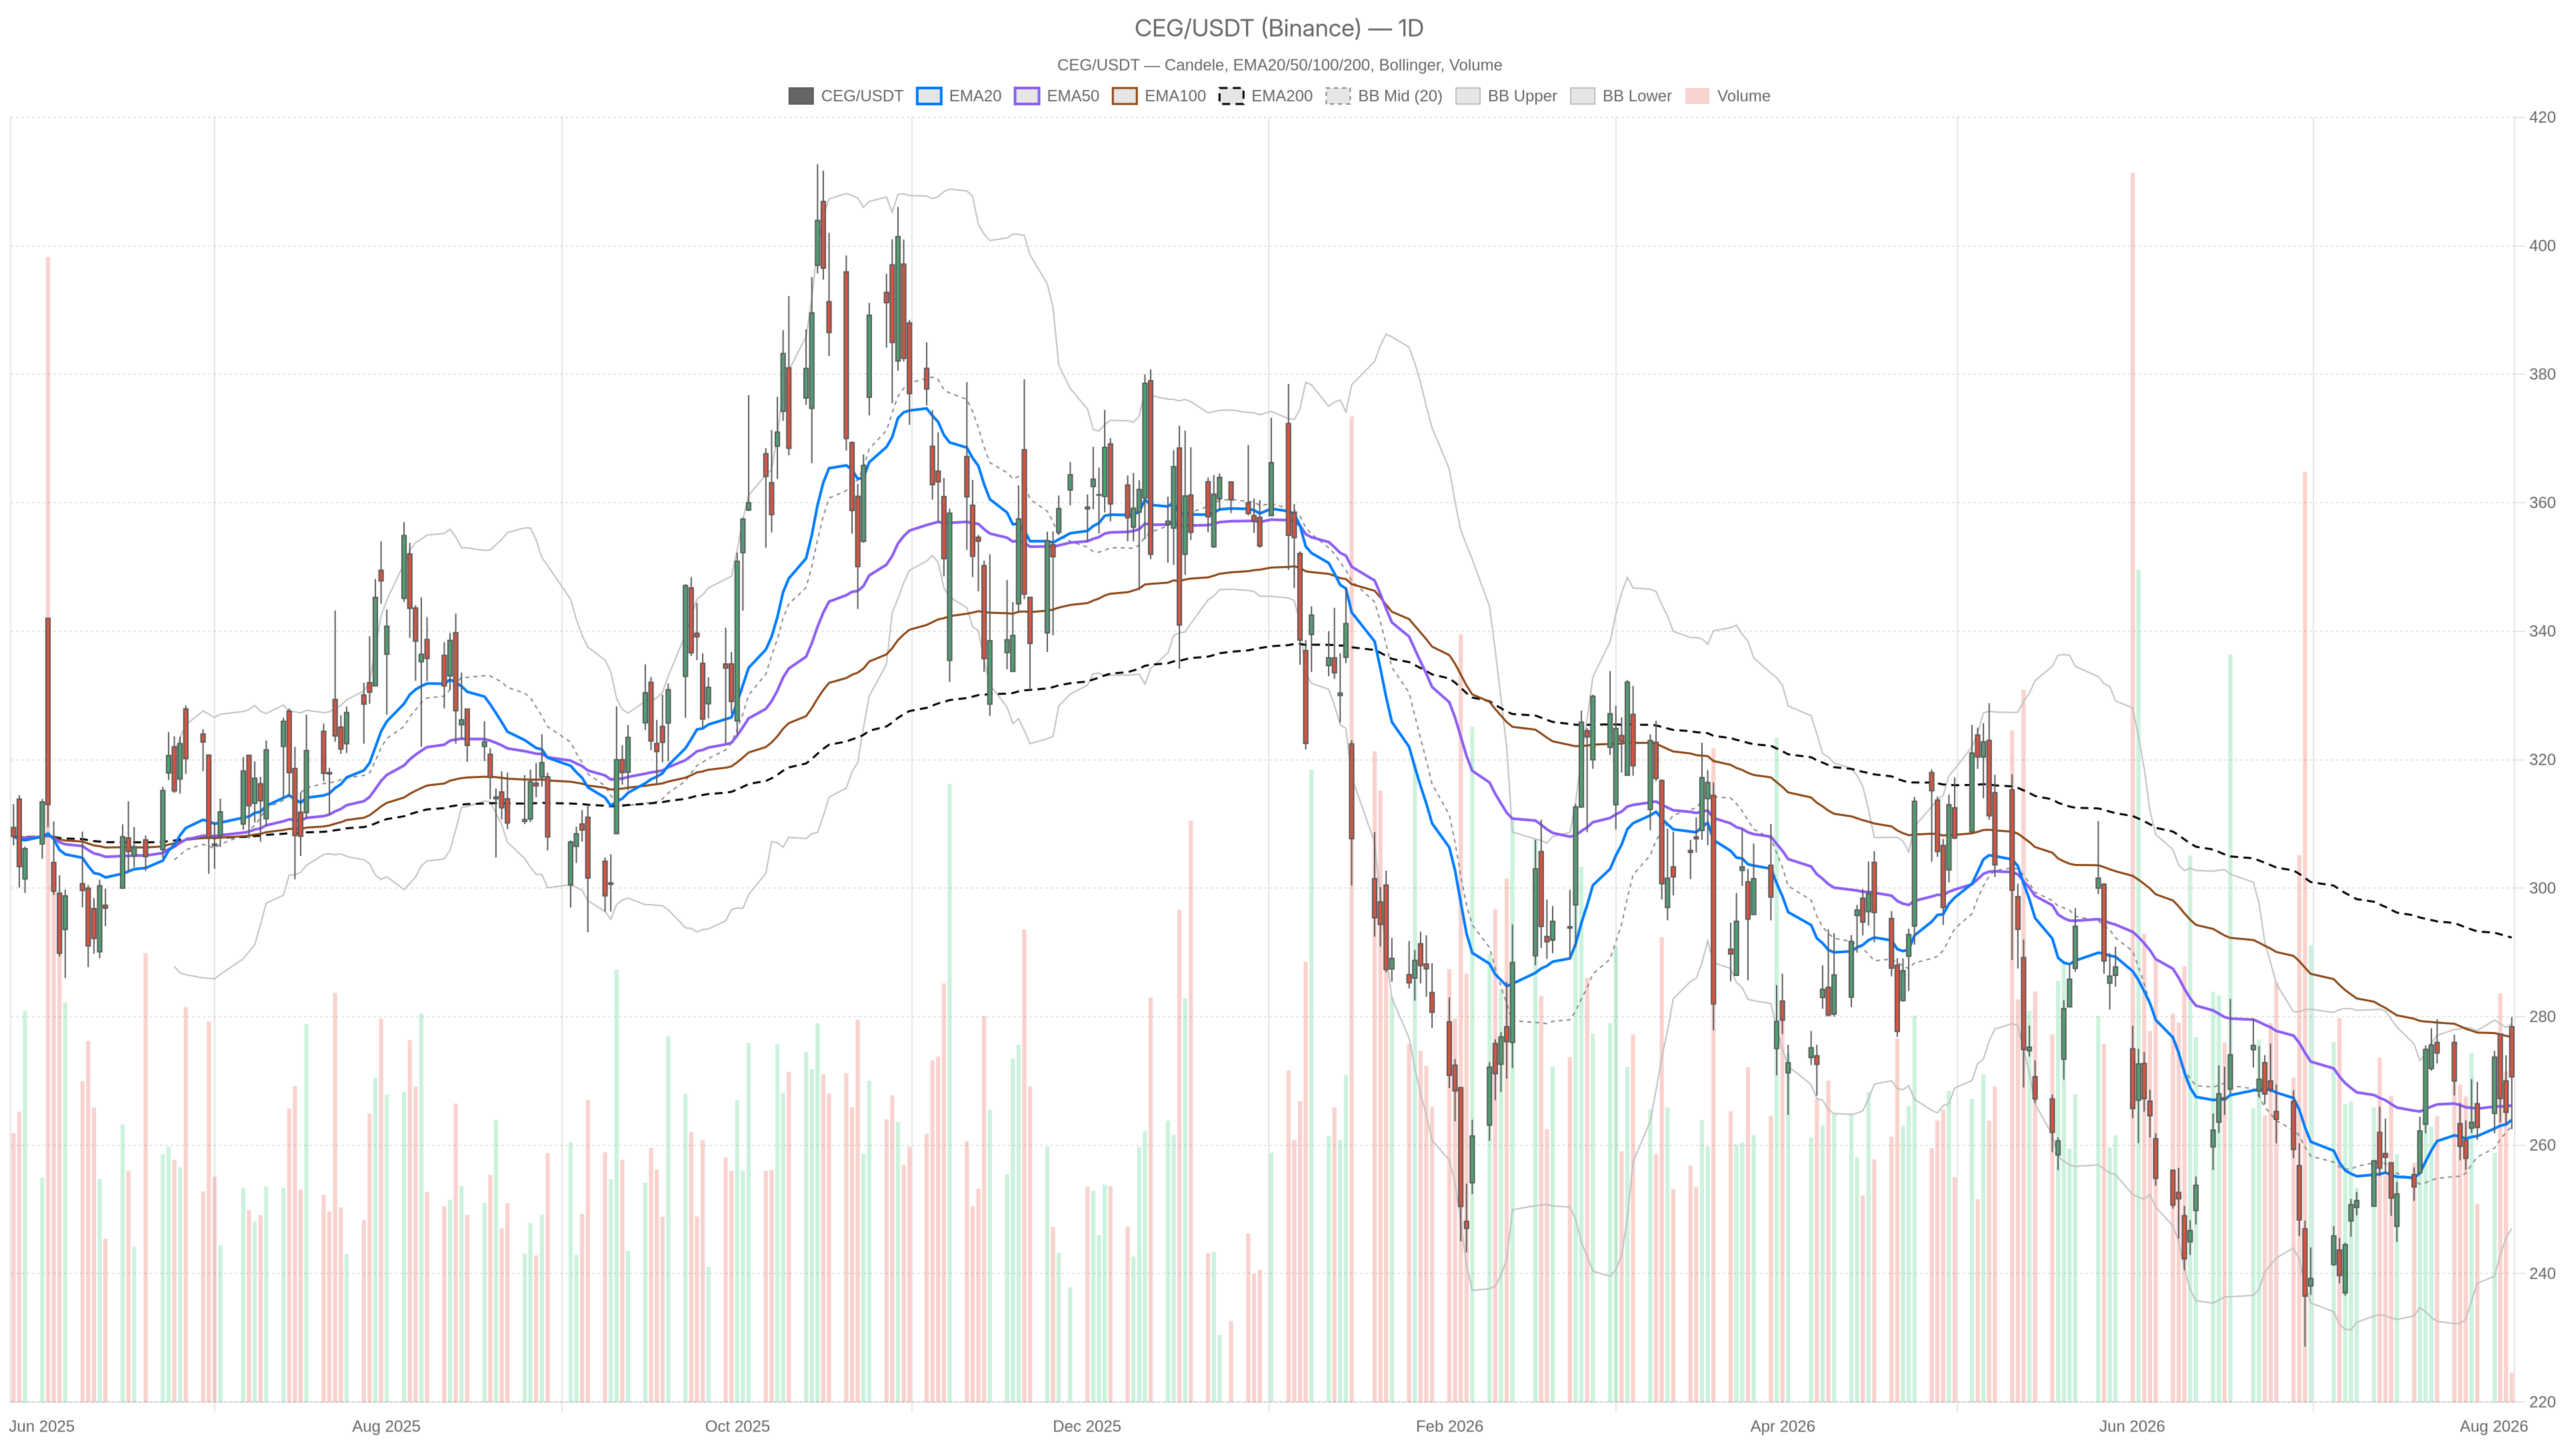
- The daily chart holds above the 20-day EMA ($263.93) and 50-day EMA ($266.20), but remains far below the 200-day EMA at $292.33.
- Daily RSI14 at 55.45 is neutral-to-firm, leaving room for further upside without an immediate momentum ceiling.
- Seeking Alpha analysts assigned a $355 price target, implying roughly 35% upside from current levels.
- Q2 earnings represent the key near-term catalyst that could validate either the bullish or bearish scenario.
Daily chart sets a cautiously constructive tone
The daily chart presents a neutral picture where near-term bullish signals conflict with the longer-term corrective structure. Price holds above both the 20-day EMA ($263.93) and the 50-day EMA ($266.20), which is a near-term positive.
However, the 200-day EMA sits far above at $292.33, and that gap is the single most important structural fact on the chart. It confirms CEG remains inside a broader corrective phase even as it stages a bounce.
RSI14 at 55.45 is neutral-to-firm, not overbought. MACD is more encouraging: the line at 2.19 sits above the signal at 1.26, with a positive histogram of 0.93, pointing to building bullish momentum on a daily basis.
Bollinger Bands show price near the upper band ($278.89) relative to the midline ($262.95). The lower band at $247.01 marks where sellers previously found support. The daily pivot at $271.03 is essentially where price trades right now, with resistance at $279.56 (R1) and support at $262.08 (S1). ATR14 of $10.64 confirms this is a genuinely volatile stock at the moment.
Hourly momentum confirms the short-term bounce
The hourly chart confirms a clean bullish structure, with EMA20 ($267.22) above EMA50 ($266.62) above EMA200 ($262.35). This is a textbook bullish stack for the intraday trend, and RSI14 at 57.63 backs that up without flagging exhaustion.
MACD on the hourly is positive but modest. The line at 0.12 barely sits above the signal at 0.09, with a histogram of just 0.03. That is bullish, but it represents a thin edge rather than a strong thrust.
Price trades above the hourly pivot ($269.93), between that level and R1 at $271.85, with S1 at $268.76 as the nearest intraday cushion. In practice, this means the current move looks like a bounce inside a larger downtrend, not yet a confirmed reversal.
15-minute chart: extended and due for a pause
The 15-minute chart signals that momentum has run ahead of price, with an overbought reading above the upper Bollinger Band. RSI14 has climbed to 63.03, and MACD shows a clear bullish crossover, with the line at 0.47 well above the signal at -0.18.
Notably, price at $270.62 has pushed above the upper Bollinger Band at $269.47. That is a short-term overbought signal. It suggests the current leg higher may be due for consolidation or a pullback toward the 15-minute pivot at $269.92, or even toward EMA20 at $266.53, before any further advance.
The 15-minute regime is labeled neutral despite the bullish indicator readings. This is itself a useful flag: momentum has run ahead of trend confirmation on this timeframe. For anyone timing entries, this argues for patience rather than chasing strength into resistance.
Bullish scenario for CEG
The bullish case hinges on the daily MACD crossover holding and price clearing resistance at $279.56. If CEG can push through that level, the next real test becomes the 200-day EMA near $292.33. That is a meaningful distance, but it is the level that would confirm a genuine trend change rather than a bounce.
The fundamental backdrop offers some support. Seeking Alpha has flagged Constellation Energy as a Strong Buy with a $355 price target, citing the company’s position atop the largest nuclear fleet in the United States. A separate analysis argues the stock remains attractive even after roughly 17% valuation compression, pointing to stable earnings and nuclear tailwinds tied to AI-driven power consumption.
Meanwhile, the declared quarterly dividend of $0.4265 per share, payable September 4, 2026, signals continued shareholder returns even amid the pullback.
Bearish scenario and what would invalidate the bullish case
The bearish risk centers on a daily close below the 50-day EMA at $266.20. A move below that, and especially below S1 support at $262.08, would reassert the dominance of the 200-day EMA overhang at $292.33. That would shift the narrative from recovery back to correction.
Yahoo Finance’s earnings preview raises a specific concern. Despite double-digit growth estimates and demand tailwinds, weaker margins remain a real issue heading into the Q2 report. If margin pressure shows up in the numbers, the current bounce could stall quickly, particularly given how far price already sits below the 200-day trend.
Therefore, a break of the lower daily Bollinger Band near $247.01 would be a much more serious signal, confirming that sellers have regained full control. The earnings print itself functions as the key catalyst that could validate either scenario.
Positioning into earnings
Overall, Constellation Energy Corporation stock shows a classic conflict between timeframes. The daily chart remains neutral and technically vulnerable given the distance to the 200-day EMA. At the same time, short-term momentum on the hourly and 15-minute charts leans bullish.
Elevated ATR readings on both the daily ($10.64) and hourly ($4.26) timeframes confirm this is not a low-volatility setup. With Q2 earnings approaching and analyst views split between aggressive upside targets and margin concerns, uncertainty is elevated. Traders should weigh the near-term overbought signal against the constructive hourly trend, while keeping the daily pivot and EMA cluster in view as the levels that will likely decide whether this bounce extends or fades.
FAQ
What is the current price of Constellation Energy Corporation stock?
CEG closed the daily session at $270.62, with a wide trading range between a low of $262.49 and a high reflecting a $17.48 spread from the open of $278.44.
What are the key support levels for CEG?
The most immediate support levels are the 50-day EMA at $266.20 and the daily S1 pivot at $262.08. A more significant floor sits at the lower daily Bollinger Band near $247.01, which previously marked where sellers found support.
What is the analyst price target for Constellation Energy?
Seeking Alpha analysts have assigned a $355 price target with a Strong Buy rating, implying roughly 35% upside from current levels, citing the company’s position atop the largest nuclear fleet in the United States.
What is the upcoming dividend for CEG?
Constellation Energy declared a quarterly dividend of $0.4265 per share, payable on September 4, 2026, signaling continued shareholder returns even during the current pullback.
Disclaimer: This article is for informational purposes only and does not constitute financial advice, an investment recommendation, or a solicitation to buy or sell any financial instrument or cryptocurrency. The analysis provided is not indicative of future results. Investing in crypto assets and financial markets carries a high risk of capital loss. Always do your own research (DYOR) and consult a qualified financial advisor before making any decision.
Article produced with the assistance of artificial intelligence and reviewed by the editorial team.
0
0

 Tüm kripto, NFT ve DeFi varlıklarınızı tek bir yerden yönetin
Kullanmaya başlamak için portföyünüzü güvenli bir şekilde bağlayın.
