
Hyperliquid Price Prediction: $HYPE New ATH Pullback or Breakdown?

0
0

HYPE is buzzing across trading communities right now, caught between a short-term bounce and a bigger picture trend that is still cooling off.
Hyperliquid positions itself as a high-performance decentralized exchange built for on-chain perpetuals trading, according to the project's own materials.
This Hyperliquid Price Prediction looks at what this mixed setup could mean for HYPE going forward. Stick around till the end to see what the charts are hinting at next.
HYPE Price Today: Market Overview
Metric | Value |
Current Price | $62.643 |
7 Day Change | -1.0% |
24h Range | $59.85 - $62.87 |
Market Cap | $13.913B |
Outstanding Token Value | $35.254B |
Fully Diluted Valuation | $62.537B |
24h Trading Volume | $315.426M |
Total Value Locked (TVL) | $6.319B |
Circulating Supply | 222.446M $HYPE |
Outstanding Supply | 563.427M $HYPE |
Total Supply | 955.307M $HYPE |
Max Supply | 1B $HYPE |
Total Treasury Holding | 19,724,727 $HYPE |
Source: Data from CoinGecko as of 21/07/2026. Figures may vary slightly across other tracking websites.
Why Is HYPE Price Pulling Back After ETF Outflows
A widely shared report from CoinMarketCap noted that spot HYPE ETFs shed $7.26 million last week, which ended a 9-week streak of steady inflows. 
This is a mild warning sign for sentiment, though it does not point to heavy selling on its own; it simply means the consistent buying pressure from ETF flows has paused for now.
Source: Data From X
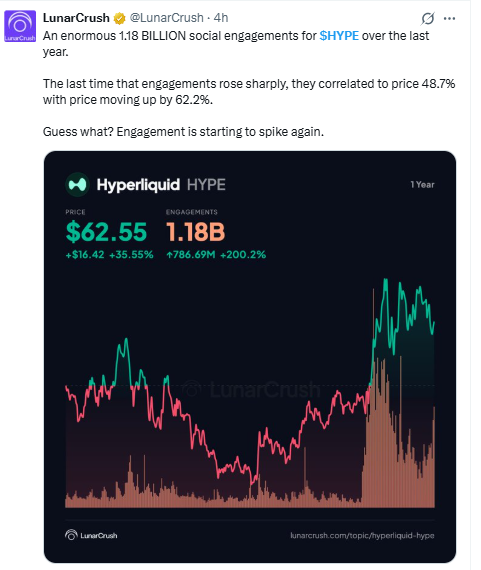
At the same time, a separate report from LunarCrush pointed to a huge jump in social activity around HYPE, with 1.18 billion social engagements over the past year.
The report noted that the last time engagement rose this sharply, it lined up with price moving 62.2% higher, and engagement is starting to spike again now.
This is a third-party observation based on social data, not a confirmed price signal, so it should be read as an early sentiment indicator rather than a guarantee of a repeat move.
Between the ETF outflow pause and the renewed social buzz, the picture right now is genuinely mixed rather than clearly bullish or bearish.
HYPE Support Resistance: Chart Analysis Short Term
HYPE fell hard between July 16 and July 18, dropping close to a key support zone of $58.541 before turning back up.
The EMA 9 has just crossed back above the EMA 20, a short-term bullish signal that shows the recent average price is climbing again after the drop.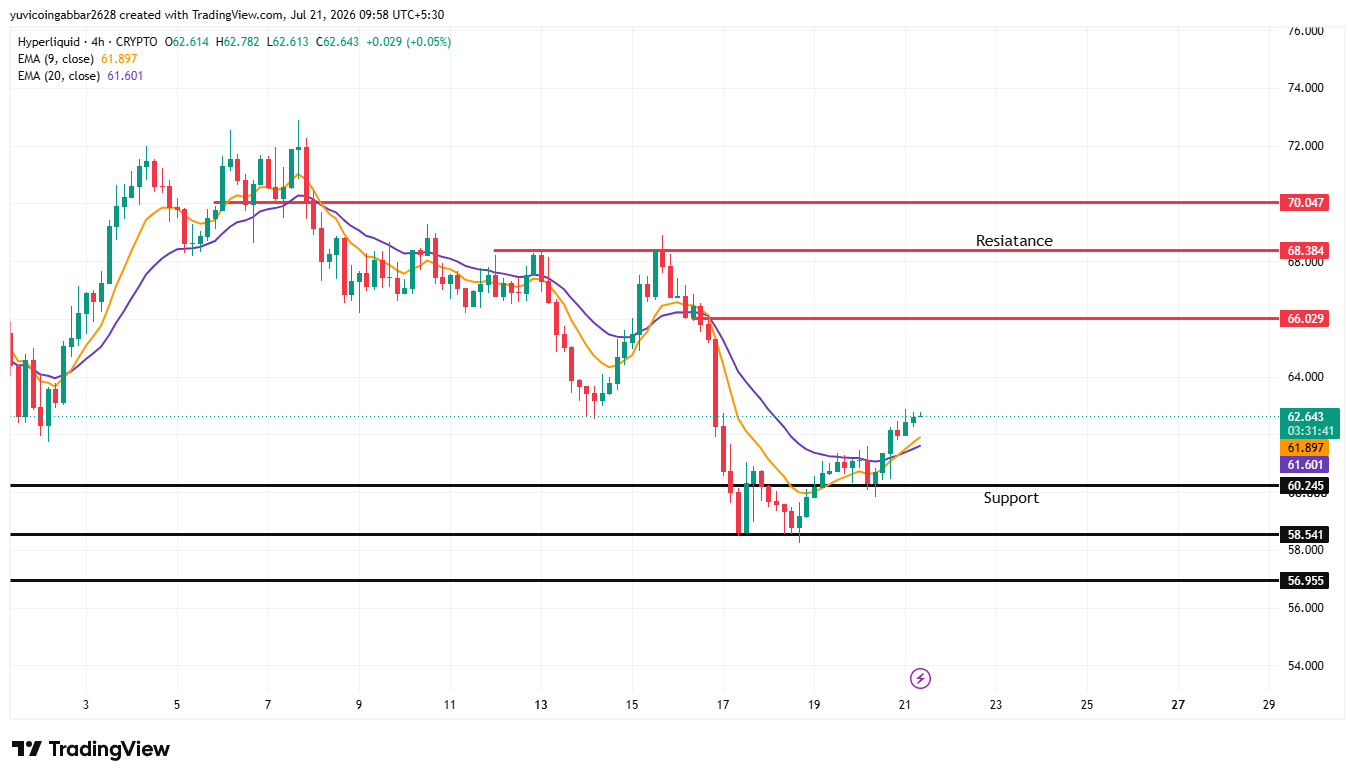
HYPE price analysis: Short-term target levels
Level Type | Price |
Resistance | $70.047 |
Resistance (closer) | $68.384 |
Resistance (near-term) | $66.029 |
$EMA 20 | $61.601 |
EMA 9 (initial recovery level) | $61.897 |
Immediate price reference | $62.643 |
First support | $60.245 |
Deeper support | $58.541 |
Deeper support (lower) | $56.955 |
Hyperliquid Technical Analysis: Long-Term
HYPE rallied sharply from 15 May and into early June, then ran into a resistance zone of $74.587 and pulled back. It found support around $53.25 and pushed higher again, forming a rising trendline under the whole move.
Price tested that resistance zone a second time in early July but could not clear it, generating a lower high compared to the first attempt.
After that second rejection, price broke down through the rising trendline, and the fall was sharp. It has since found a bottom and started to recover a little, but EMA 9 is at $62.834 and EMA 20 is at $64.161, with the shorter EMA still below the longer one. 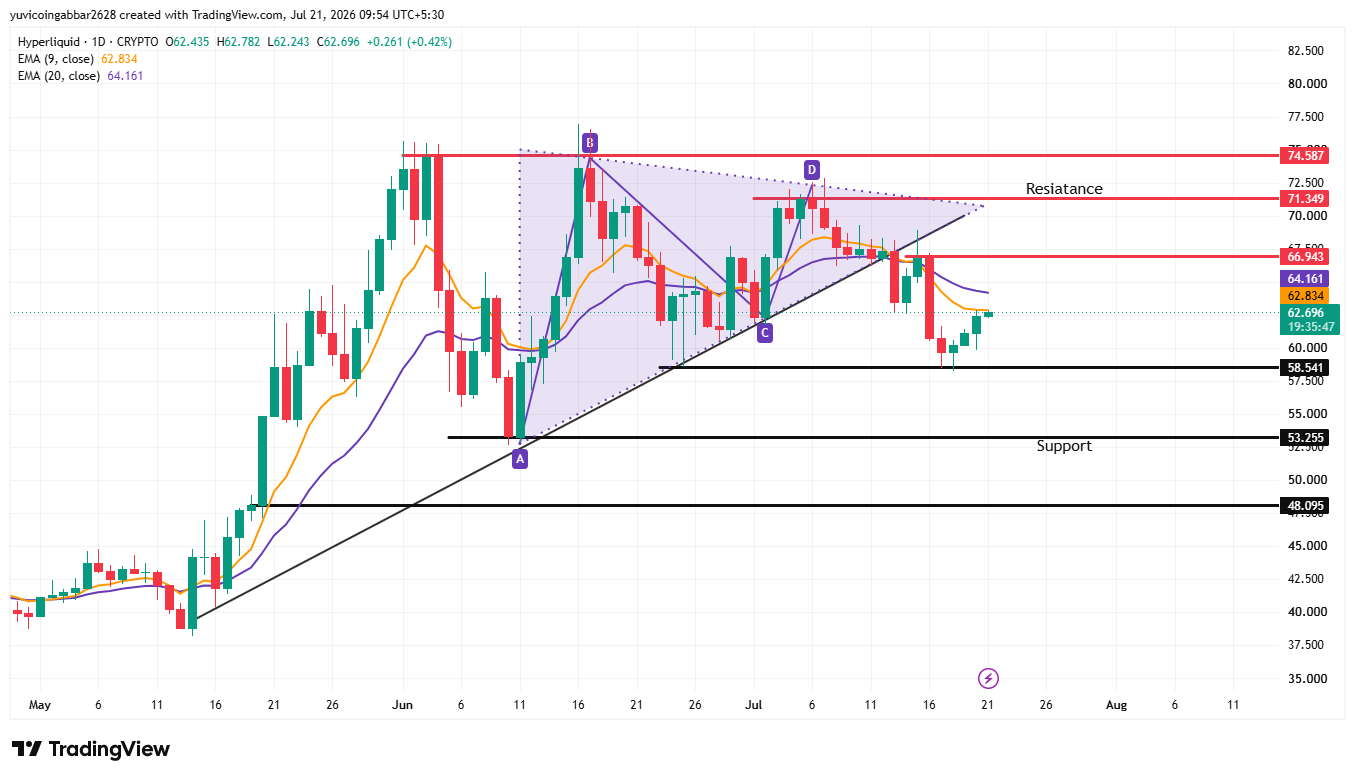
That means the bigger picture trend is still cooling off, even though the smaller 4H chart already turned bullish.
HYPE price prediction 2026
Level Type | Price |
Resistance | $74.587 |
Resistance (closer) | $71.349 |
Resistance (near-term) | $66.943 |
$EMA 20 | $64.161 |
EMA 9 (initial recovery level) | $62.834 |
First support | $58.541 |
Deeper support | $53.255 |
Deeper support (lower) | $48.095 |
Two Reader Takeaways for HYPE Price Forecast
For existing holders, the level to watch is the daily first confirmed support at $58.541. Holding above that keeps the bigger structure intact even with the trendline break.
For anyone considering an entry, it may be worth waiting to see if the 4H bullish EMA crossover carries through to the daily chart before treating this bounce as a full trend change rather than assuming the pullback is over.
Hyperliquid Market Outlook: Expert View
According to CoinGabbar analysts, this setup calls for a balanced read rather than a one-sided call. The bull case leans on the 4H EMA crossover and the renewed social engagement spike, which previously lined up with a strong upward move.
The bear case leans on the daily trendline break and the EMA 9 still sitting below the EMA 20 on the bigger timeframe, plus last week's ETF outflows breaking a long inflow streak.
A close back above $66.029 would strengthen the bullish case, while a close below $58.541 would strengthen the bearish one. Until then, this looks more like a genuine two-sided market than a clear trend in either direction.
Disclaimer: This article is for informational purposes only and should not be treated as financial advice. Cryptocurrency markets are highly volatile and carry significant risk.
0
0


 Управляйте всей своей криптовалютой, NFT и DeFi из одного места
Безопасно подключите используемый вами портфель для начала.


0
0

0
0

0
0