Pepe (PEPE) Price Prediction 2026, 2027-2030

0
0

- Bullish PEPE price prediction for 2026 is $0.00000523 to $0.00000745.
- Pepe (PEPE) price might reach $0.0001 soon.
- Bearish PEPE price prediction for 2026 is $0.00000246.
In this Pepe (PEPE) price prediction 2026, 2027-2030, we will analyze the price patterns of PEPE by using accurate trader-friendly technical analysis indicators and predict the future movement of the cryptocurrency.
TABLE OF CONTENTS |
INTRODUCTION |
|
PEPE (PEPE) PRICE PREDICTION 2026 |
|
| PEPE (PEPE) PRICE PREDICTION 2027, 2028-2030 |
| CONCLUSION |
| FAQ |
Pepe (PEPE) Current Market Status
| Current Price | $0.000004966 | 24 – Hour Price Change | 2.22% Up |
| 24 – Hour Trading Volume | $376.1M |
| Market Cap | $2.05B |
| Circulating Supply | 413.77T PEPE | All – Time High | $0.00002825 (On Dec 09, 2024) |
| All – Time Low | $0.00000001062 (On Apr 14, 2023) |
What is Pepe (PEPE)
| TICKER | PEPE |
| BLOCKCHAIN | Ethereum |
| CATEGORY | Memecoin |
| LAUNCHED ON | April 2023 |
| UTILITIES | Governance, security, gas fees & rewards |
A deflationary memecoin launched on Ethereum is PEPE. PEPE presents a unique offering within the meme coin market by building upon the legacy of Pepe the Frog, a character with a longstanding and controversial history. PEPE‘s burning mechanism further highlights its distinct nature, aiming to maintain scarcity within the market.
PEPE is an ERC-20 token on the Ethereum blockchain, which is secured by the Proof-of-Stake (PoS) consensus mechanism. Decentralized validators stake 32 ETH to process transactions and secure the network.
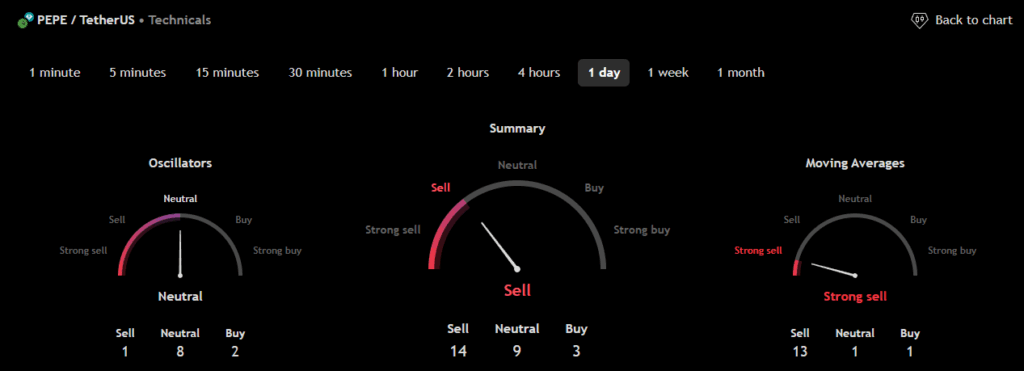
Pepe 24H Technicals
Pepe (PEPE) Price Prediction 2026
Pepe (PEPE) ranks 40th on CoinMarketCap in terms of its market capitalization. The overview of the Pepe price prediction for 2026 is explained below with a daily time frame.
In the above chart, Pepe (PEPE) laid out a Horizontal Channel pattern, also known as the sideways trend. In general, the horizontal channel is formed during the price consolidation. In this pattern, the upper trendline, the line which connects the highs, and the lower trendline, the line which connects the lows, run horizontally parallel, and the price action is contained within it.
A horizontal channel is often regarded as one of the suitable patterns for timing the market, as the buying and selling points are in consolidation.
At the time of analysis, the price of Pepe (PEPE) was recorded at $0.000004966. If the pattern trend continues, then the price of PEPE might reach the resistance levels of $0.00000518 and $0.00000686. If the trend reverses, then the price of PEPE may fall to the support levels of $0.00000451 and $0.00000394.
Pepe (PEPE) Resistance and Support Levels
The chart given below elucidates the possible resistance and support levels of Pepe (PEPE) in 2026.
From the above chart, we can analyze and identify the following as resistance and support levels of Pepe (PEPE) for 2026.
| Resistance Level 1 | $0.00000523 |
| Resistance Level 2 | $0.00000745 |
| Support Level 1 | $0.00000363 |
| Support Level 2 | $0.00000246 |
PEPE Resistance & Support Levels
Pepe (PEPE) Price Prediction 2026 — RVOL, MA, and RSI
The technical analysis indicators such as Relative Volume (RVOL), Moving Average (MA), and Relative Strength Index (RSI) of Pepe (PEPE) are shown in the chart below.
From the readings on the chart above, we can make the following inferences regarding the current Pepe (PEPE) market in 2026.
| INDICATOR | PURPOSE | READING | INFERENCE |
| 50-Day Moving Average (50MA) | Nature of the current trend by comparing the average price over 50 days | 50 MA = $0.00000414Price = $0.00000514 (50MA < Price) | Bullish/Uptrend |
| Relative Strength Index (RSI) | Magnitude of price change;Analyzing oversold & overbought conditions | 85.07863304 <30 = Oversold 50-70 = Neutral>70 = Overbought | Overbought |
| Relative Volume (RVOL) | Asset’s trading volume in relation to its recent average volumes | Below cutoff line | Weak Volume |
Pepe (PEPE) Price Prediction 2026 — ADX, RVI
In the chart below, we analyze the strength and volatility of Pepe (PEPE) using the following technical analysis indicators — Average Directional Index (ADX) and Relative Volatility Index (RVI).
From the readings on the chart above, we can make the following inferences regarding the price momentum of Pepe (PEPE).
| INDICATOR | PURPOSE | READING | INFERENCE |
| Average Directional Index (ADX) | Strength of the trend momentum | 28.29609625 | Strong Trend |
| Relative Volatility Index (RVI) | Volatility over a specific period | 65.41 <50 = Low >50 = High | High Volatility |
Comparison of PEPE with BTC, ETH
Let us now compare the price movements of Pepe (PEPE) with that of Bitcoin (BTC), and Ethereum (ETH).
From the above chart, we can interpret that the price action of PEPE is similar to that of BTC and ETH. That is, when the price of BTC and ETH increases or decreases, the price of PEPE also increases or decreases, respectively.
Pepe (PEPE) Price Prediction 2027, 2028 – 2030
With the help of the aforementioned technical analysis indicators and trend patterns, let us predict the price of Pepe (PEPE) between 2027, 2028, 2029, and 2030.
| Year | Bullish Price | Bearish Price |
| Pepe (PEPE) Price Prediction 2027 | $0.0003 | $0.000002 |
| Pepe (PEPE) Price Prediction 2028 | $0.0004 | $0.000001 |
| Pepe (PEPE) Price Prediction 2029 | $0.0005 | $0.0000009 |
| Pepe (PEPE) Price Prediction 2030 | $0.0006 | $0.0000008 |
Conclusion
If Pepe (PEPE) establishes itself as a good investment in 2026, this year would be favorable to the cryptocurrency. In conclusion, the bullish Pepe (PEPE) price prediction for 2026 is $0.00000745. Comparatively, if unfavorable sentiment is triggered, the bearish Pepe (PEPE) price prediction for 2026 is $0.00000246.
If the market momentum and investors’ sentiment positively elevate, then Pepe (PEPE) might hit $0.0001. Furthermore, with future upgrades and advancements in the Pepe ecosystem, PEPE might surpass its current all-time high (ATH) of $0.00002825 and mark its new ATH.
FAQ
1. What is Pepe (PEPE)?
A deflationary meme coin launched on Ethereum is PEPE. PEPE presents a unique offering within the meme coin market by building upon the legacy of Pepe the Frog, a character with a longstanding and controversial history.
2. Where can you buy Pepe (PEPE)?
Traders can trade Pepe (PEPE) on the following cryptocurrency exchanges such as Binance, OKX, Bybit, Bitunix, and DigiFinex.
3. Will Pepe (PEPE) record a new ATH soon?
With the ongoing developments and upgrades within the Pepe platform, Pepe (PEPE) has a high possibility of reaching its ATH soon.
4. What is the current all-time high (ATH) of Pepe (PEPE)?
Pepe (PEPE) hit its current all-time high (ATH) of $0.00002825 On Dec 09, 2024.
5. What is the lowest price of Pepe (PEPE)?
According to CoinMarketCap, PEPE hit its all-time low (ATL) of $0.00000001062 on Apr 17, 2023.
6. Will Pepe (PEPE) hit $0.0001?
If Pepe (PEPE) becomes one of the active cryptocurrencies that majorly maintain a bullish trend, it might rally to hit $0.0001 soon.
7. What will be the Pepe (PEPE) price by 2027?
Pepe (PEPE) price might reach $0.0003 by 2027.
8. What will be the Pepe (PEPE) price by 2028?
Pepe (PEPE) price might reach $0.0004 by 2028.
9. What will be the Pepe (PEPE) price by 2029?
Pepe (PEPE) price might reach $0.0005 by 2029.
10. What will be the Pepe (PEPE) price by 2030?
Pepe (PEPE) price might reach $0.0006 by 2030.
Top Crypto Predictions
Disclaimer: The opinion expressed in this article is solely the author’s. It does not represent any investment advice. TheNewsCrypto team encourages all to do their own research before investing.
0
0


 Управляйте всей своей криптовалютой, NFT и DeFi из одного места
Безопасно подключите используемый вами портфель для начала.


0
0