Optimism (OP) Price Sees Double-Digit Decline in DEX Activity in 7 Days
2h ago•

bullish:
0
bearish:
0
Share

In the past week, the Layer 2 (L2) scaling solution Optimism (OP) has witnessed a drop in activity across the decentralized exchanges (DEXes) housed within it.
This comes amid a broader drop in user activity across the L2 network.
Optimism’s Users Exit the Network
According to DefiLlama, over the past seven days, trading volume on the DEXes on Optimism has totaled $505 million, declining by 17%.
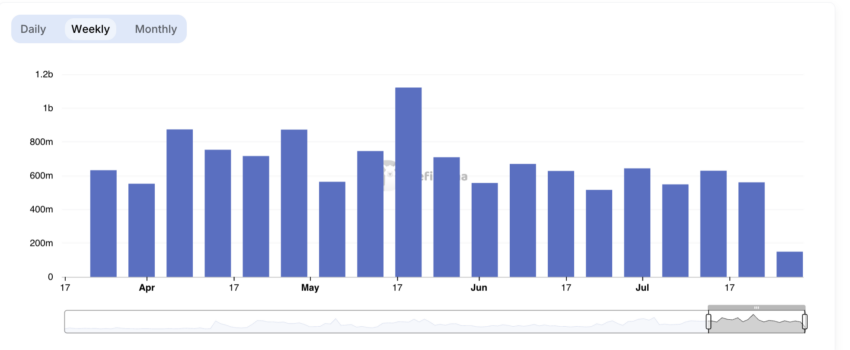 Optimism DEX Volume. Source: DefiLlama
A network’s DEX volume measures the total value of cryptocurrencies traded on its DEXes within a specified period. It is a key indicator of the overall activity and liquidity within the network’s decentralized finance (DeFi) ecosystem.
When it surges, it signals increased trading activity and interest in the network. Conversely, a low trading volume across a network’s DEXes reflects a bearish or cautious sentiment among investors and network users.
The decline in Optimism’s DEX volume in the past week mirrors the drop in user activity on the network during the same period. According to Artemis, the total number of daily unique on-chain wallets interacting with the network has plummeted by 16% in the past seven days.
Read More: What Is Optimism?
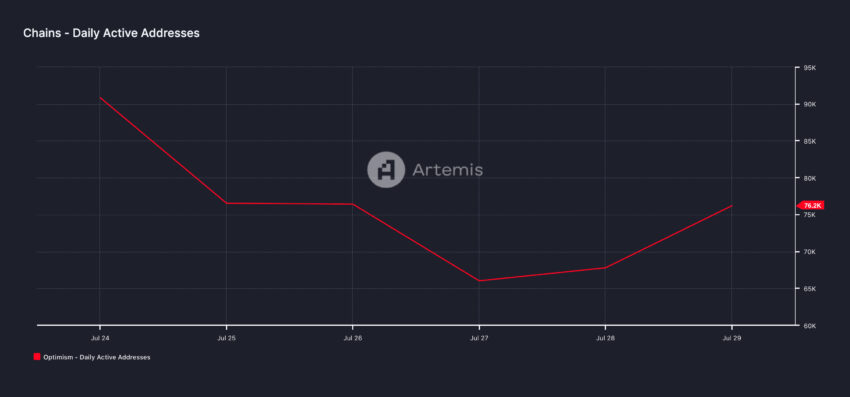 Optimism Daily Active Addresses. Source: Artemis
Due to the reduced number of users on the network, Optimism’s daily fees have trended downward during the period in review. In the past seven days, the L2’s total daily fees have plunged by 70%.
OP Price Prediction: Death Cross Signals Risk of Further Downsides for Token
An assessment of OP’s price movements on a one-day chart reveals that its 50-day exponential moving average (EMA) (blue line) crossed below its 200-day EMA (yellow line) on May 12 and has since trended further from it.
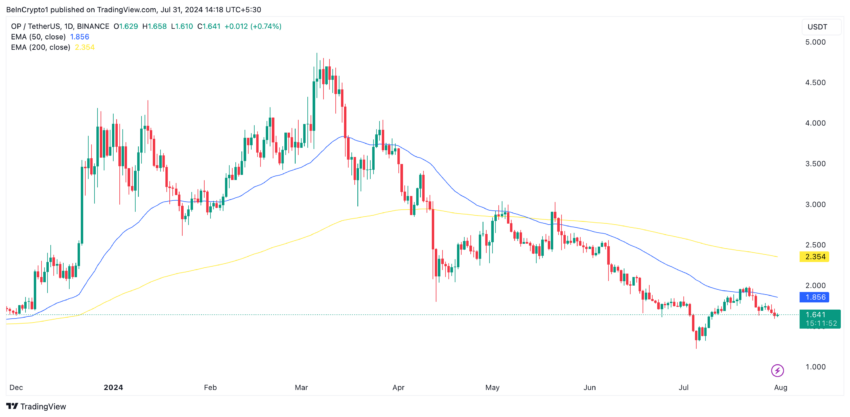 Optimism Analysis. Source: TradingView
An asset’s 50-day EMA calculates its average price over the last 50 days. It is considered a short- to mid-term trend indicator. On the other hand, the 200-day EMA measures the average price of an asset over the last 200 days. It is a long-term trend indicator.
When the 50-day EMA crosses below the 200-day EMA, a Death Cross occurs. This crossover is a notable bearish sign that confirms a shift from an uptrend to a downtrend.
Traders often interpret it as a signal to short an asset, as it signals the commencement of an extended downtrend. Since the crossover, OP’s price has declined by 32%.
If this trend continues, OP’s price will plummet further. Its next price target is the nine-month low of $1.22.
Read More: Optimism vs. Arbitrum: Ethereum Layer-2 Rollups Compared
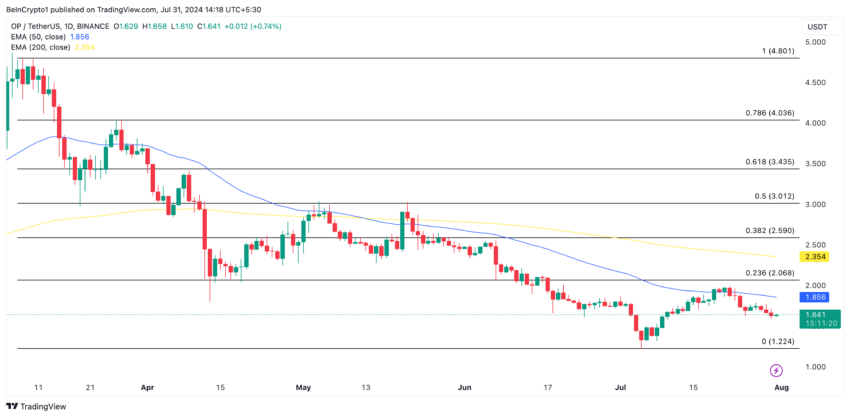 Optimism Analysis. Source: TradingView
However, if market sentiment shifts and the OP witnesses a resurgence in bullish bias, the token’s price might rally toward $2.06.
2h ago•
bullish:
0
bearish:
0
Share


 Manage all your crypto, NFT and DeFi from one place
Securely connect the portfolio you’re using to start.

bullish:
0
bearish:
0


