FARTCOIN’s 27% Gains Face New Threats from Rising Market Volatility

0
0
Meme coin FARTCOIN has seen its value skyrocket by 27% over the past week. This bullish run culminated on January 2, with the token reaching a new all-time high of $1.47 during the day’s trading session.
However, this surge has come at a price: heightened market volatility now threatens the meme coin’s further gains.
FARTCOIN’s Gains at Risk Amid Surging Volatility
BeInCrypto’s assessment of the FARTCOIN/USD one-day chart shows that the altcoin now trades above the upper line of its Bollinger Bands Indicator.
This indicator measures an asset’s price volatility and identifies overbought or oversold conditions. It consists of three lines: a simple moving average (middle band) and two bands (upper and lower) representing standard deviations above and below the moving average.
When an asset’s price breaks above the upper band, it suggests a spike in volatility as its current value is moving significantly away from its average. It also indicates that the asset may be overbought and due for a price correction.
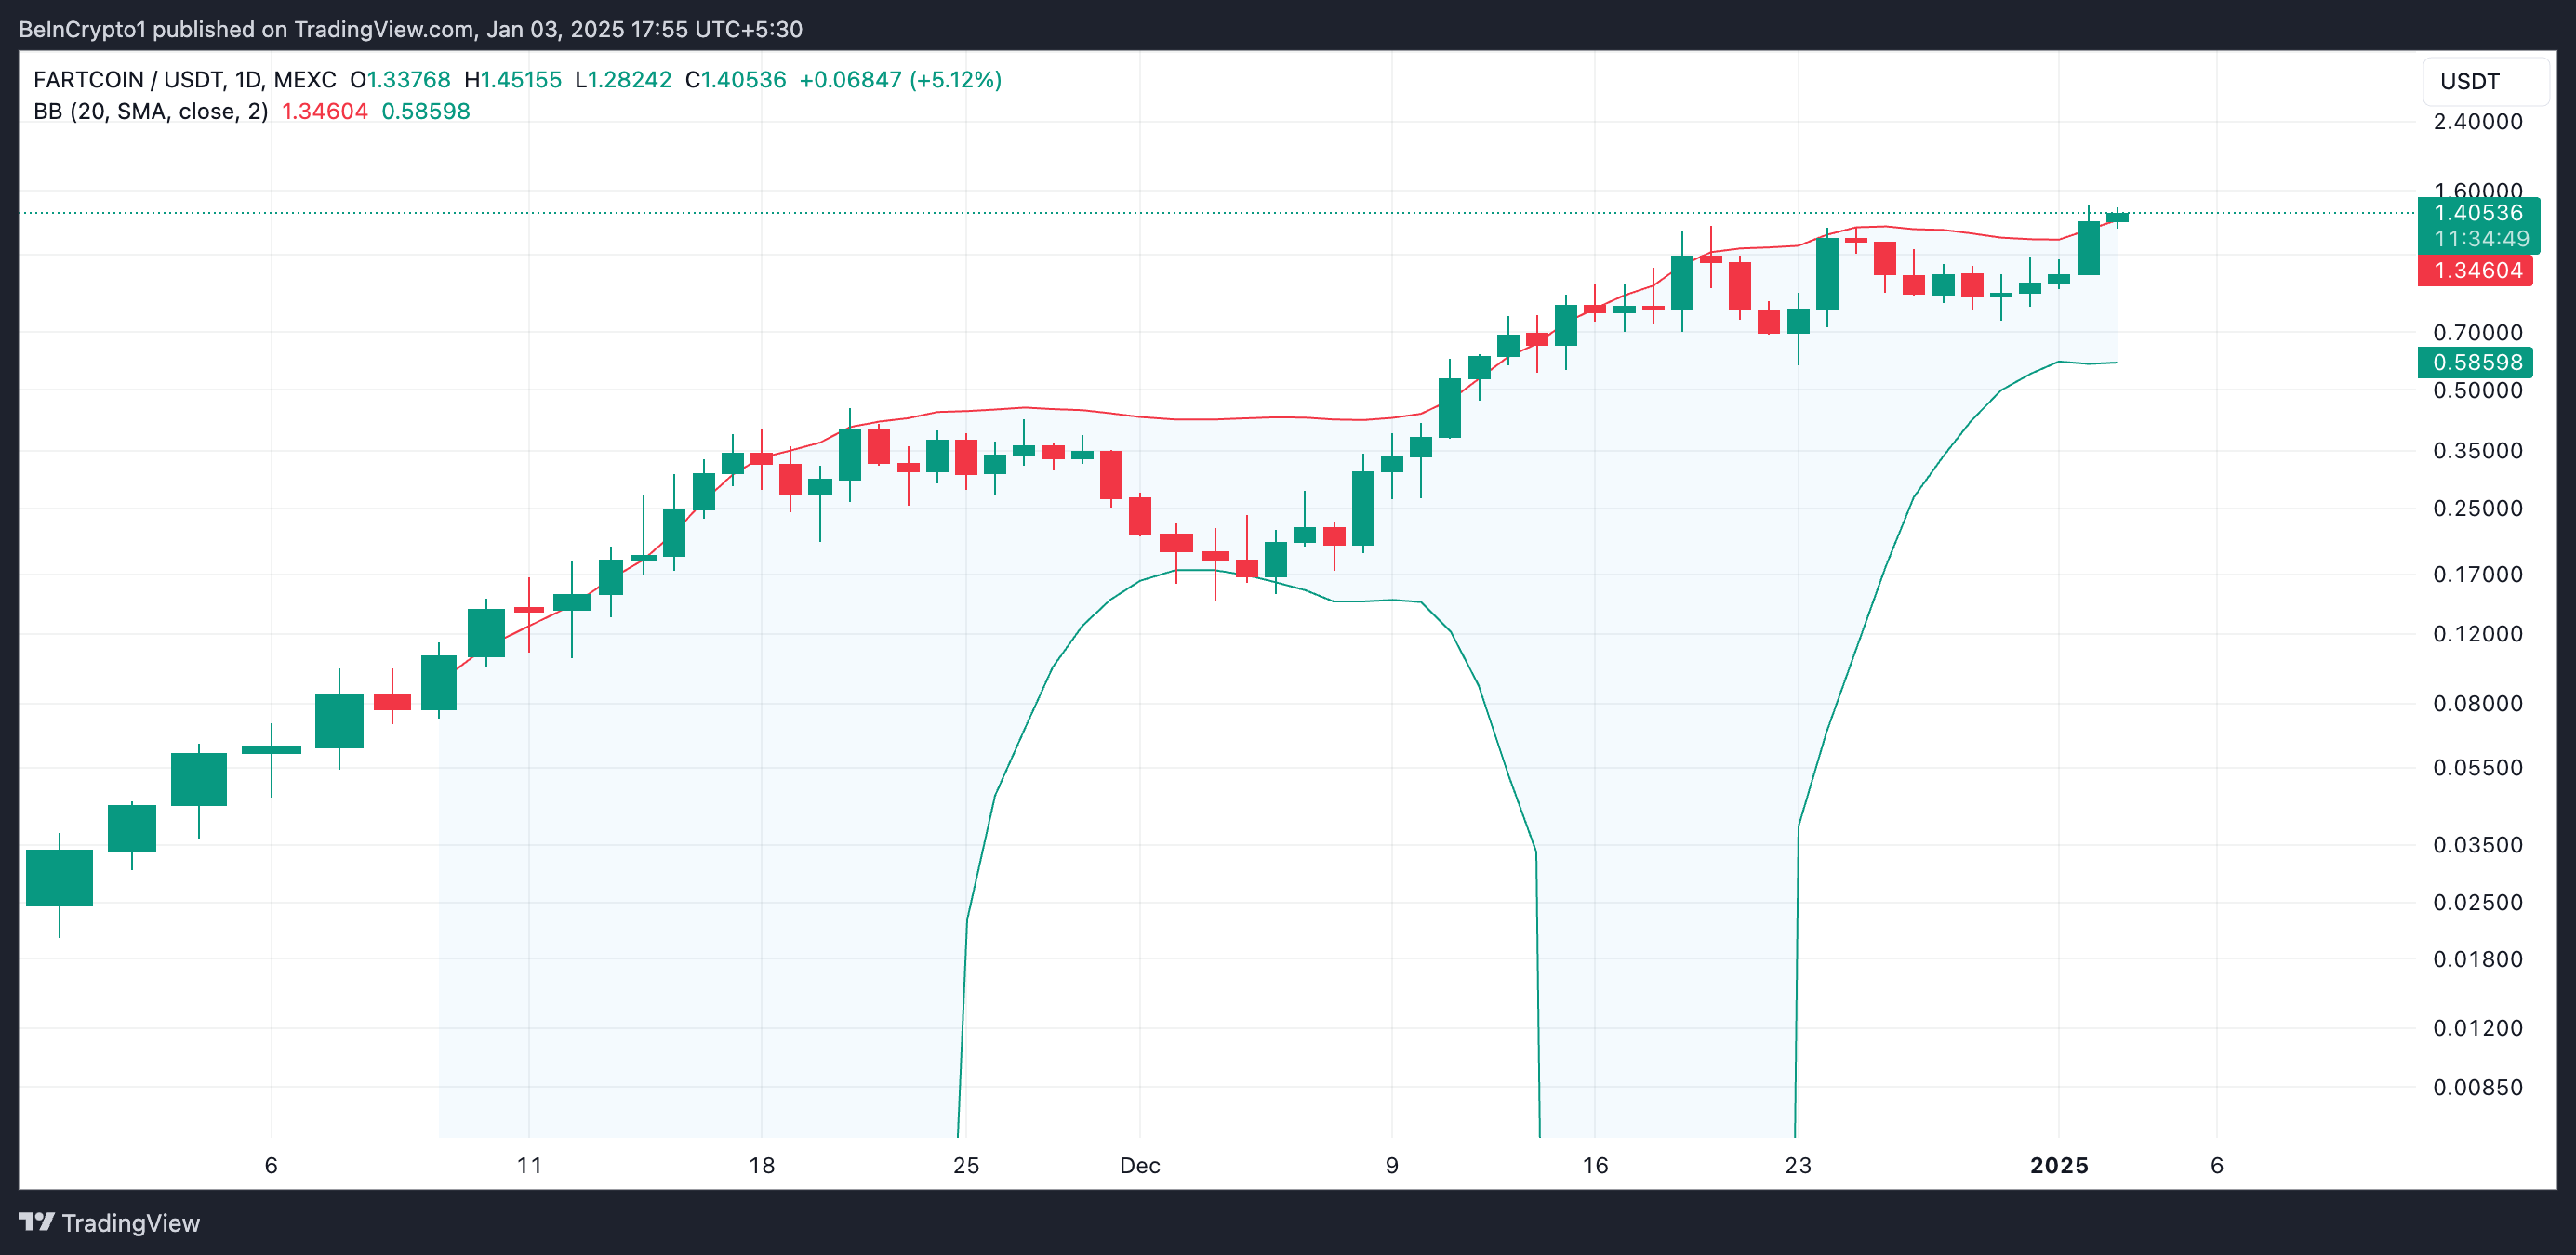 FARTCOIN Bollinger Bands. Source: TradingView
Additionally, FARTCOIN’s Average True Range (ATR) touched an all-time high of 0.25 on January 2, confirming the spike in market volatility. As of this writing, the indicator stands at 0.24.
The ATR is a volatility indicator that measures the average range between an asset’s high and low prices over a specified period. When it rises like this, it indicates a sudden increase in price movement, signifying heightened volatility in the market.
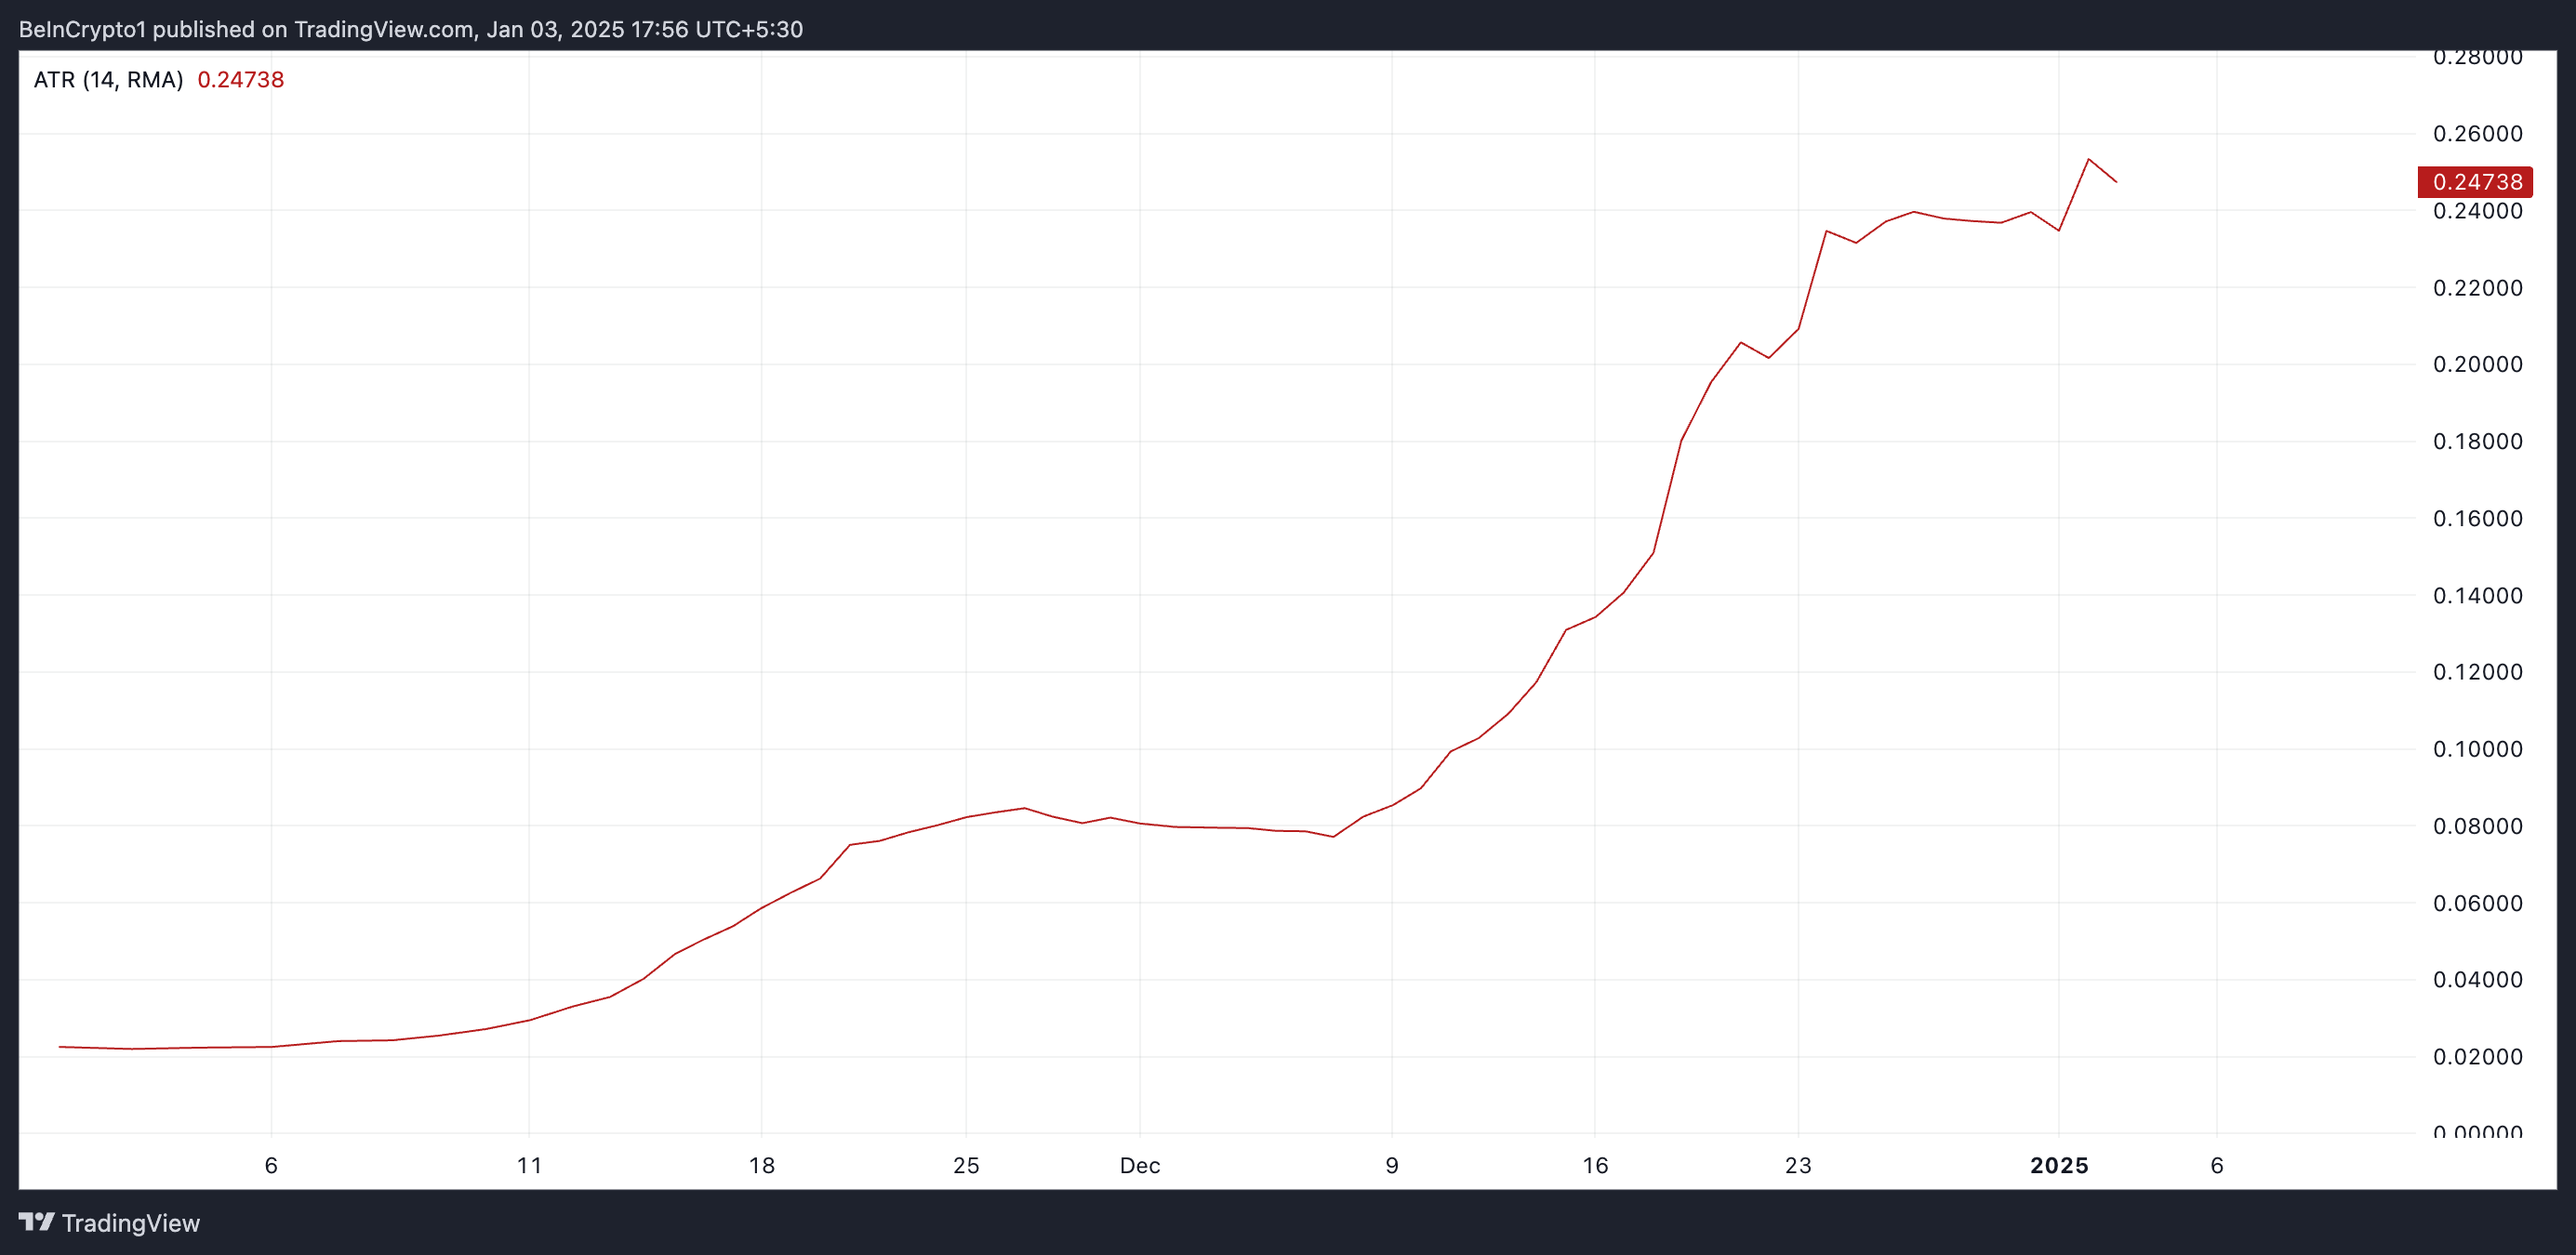 FARTCOIN Average True Range. Source: TradingView
FARTCOIN Price Prediction: Key Levels to Watch
Generally, heightened market volatility increases the likelihood of large price movements, resulting in an asset’s price breaking out in either an upward or downward direction. Hence, if bullish pressure persists, FARTCOIN may break out in an uptrend, reclaim its all-time high of $1.47, and rally further.
 FARTCOIN Price Analysis. Source: TradingView
On the other hand, if selling activity gains momentum, the meme coin’s price will break out in a downtrend and could fall to $0.53.
0
0


 Gestisci cripto, NFT e DeFi in un unico luogo
Connetti in sicurezza il portafoglio che usi per iniziare.