
Solana Price Eyes $50 Target If Descending Channel Support Breaks

0
0

Solana price is trading around $77.52 today, up a small 0.39% over the last 24 hours. The coin sits inside a narrowing range that traders have watched for months.
Spot volume over the past day came in at $6.01 billion, a jump of 14.73%. That is a decent pickup in activity even though the price barely moved.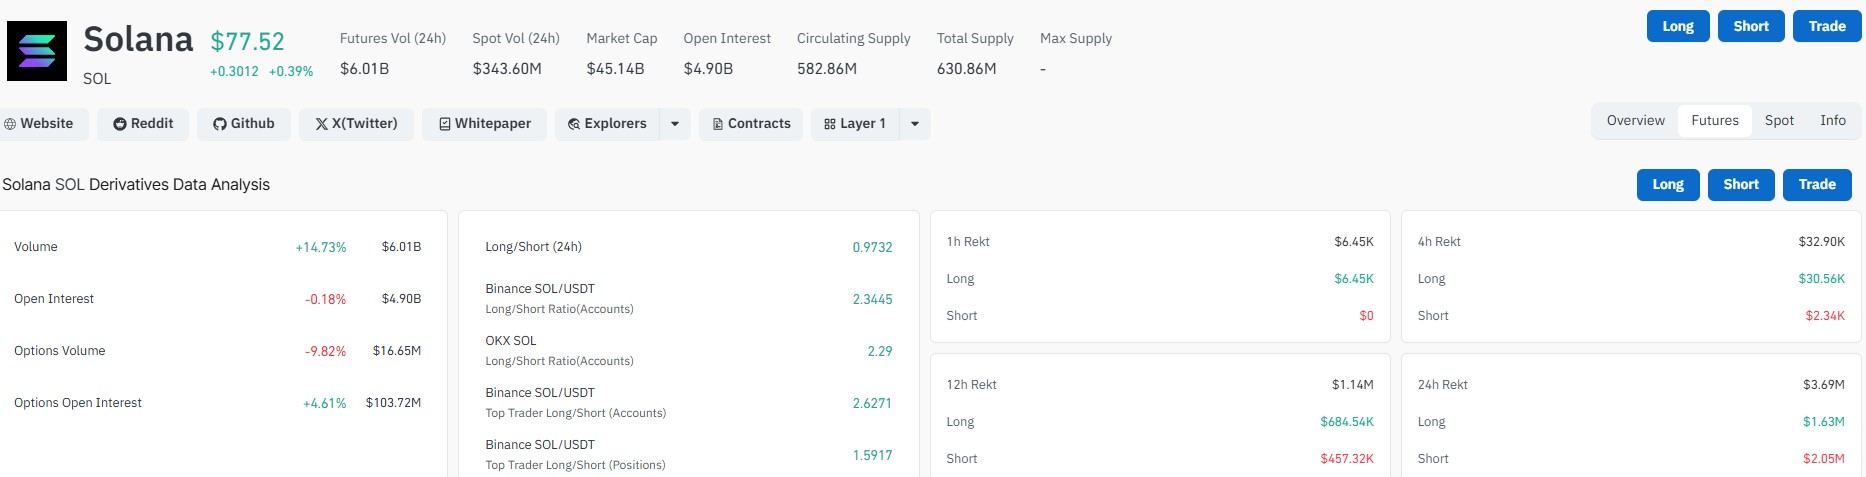
Is Solana Price in a Descending Channel Pattern?
Looking at the daily chart, SOL has been stuck inside a descending channel since March. Price made lower highs and lower lows, but the slope of the drop has flattened a bit lately.
The 20-day EMA sits at $76.89, and the 50-day EMA is close behind at $76.79. Price is basically glued to both lines right now, which usually signals indecision rather than a clear trend.
Further out, the 100-day EMA is at $80.36, and the 200-day EMA is way up at $93.43. Both longer averages are still sloping down, so the bigger picture remains bearish until SOL can climb back above them.
RSI on the daily chart reads 52.78. That is right in the middle, not overbought and not oversold. It tells us momentum is flat for now.
What Is Solana Open Interest Telling Traders?
Open interest across Solana derivatives sits at $4.90 billion, down a small 0.18% from the day before. Futures volume, though, rose sharply to $6.01 billion, up 14.73%.
Options tell a mixed story. Options volume actually fell 9.82% to $16.65 million, while options open interest climbed 4.61% to $103.72 million. That suggests traders are holding existing bets rather than opening fresh ones.
The long/short ratio across the market sits at 0.9732, close to balanced. On Binance, the SOL/USDT long/short ratio for accounts is 2.3445, showing retail leans long. Top traders on Binance show a long/short ratio of 1.5917 by position, still tilted toward longs but less aggressively.
How Much Was Liquidated in Solana Today?
Over the past 24 hours, $3.69 million in Solana positions got liquidated. Of that, $1.63 million came from longs and $2.05 million from shorts, a fairly even split.
The 4-hour window shows a bigger long squeeze, with $30.56K in long liquidations against just $2.34K in shorts. This lines up with the mild dip after the price touched $78.53 intraday.
What Does the SOL ETF Outflow Mean for Price?
Spot Solana ETFs saw net outflows of $1.27 million yesterday. It is not a huge number in the context of a $45.14 billion market cap, but it does show some investors are stepping back for now.
Continued outflows, even small ones, can add pressure if they persist over several days. Traders watching Solana price action should keep an eye on ETF flow data alongside the technical chart.
Will Solana Price Go Up or Down Next?
SOL price needs to clear the $80 to $81 zone, where the 100-day EMA sits, to shift short-term sentiment. A move above that could open the door toward $90, near the wedge's upper trendline and the falling 200-day EMA.
On the downside, the lower boundary of the descending channel lines up near $70 to $72. A break below that level could send price toward the June low around $60.
For now, $SOL price looks caught between a slowing downtrend and building support near $76 to $77. The next few daily closes near the EMA cluster will likely decide the short-term direction.
Metric | Value |
Solana Price | $77.52 |
24h Change | +0.39% |
Market Cap | $45.14B |
Spot Volume (24h) | $6.01B |
Open Interest | $4.90B |
Options Open Interest | $103.72M |
24h Liquidations | $3.69M |
ETF Flow (Yesterday) | -$1.27M |
RSI (14, Daily) | 52.78 |
Could Solana Repeat the 28% Channel-Break Drop?
The chart shows two measured-move arrows: one marking the prior ~28% decline from roughly $95 down to the June low near $68, and a second projecting a similarly-sized move from the current price zone toward the ~$50 area.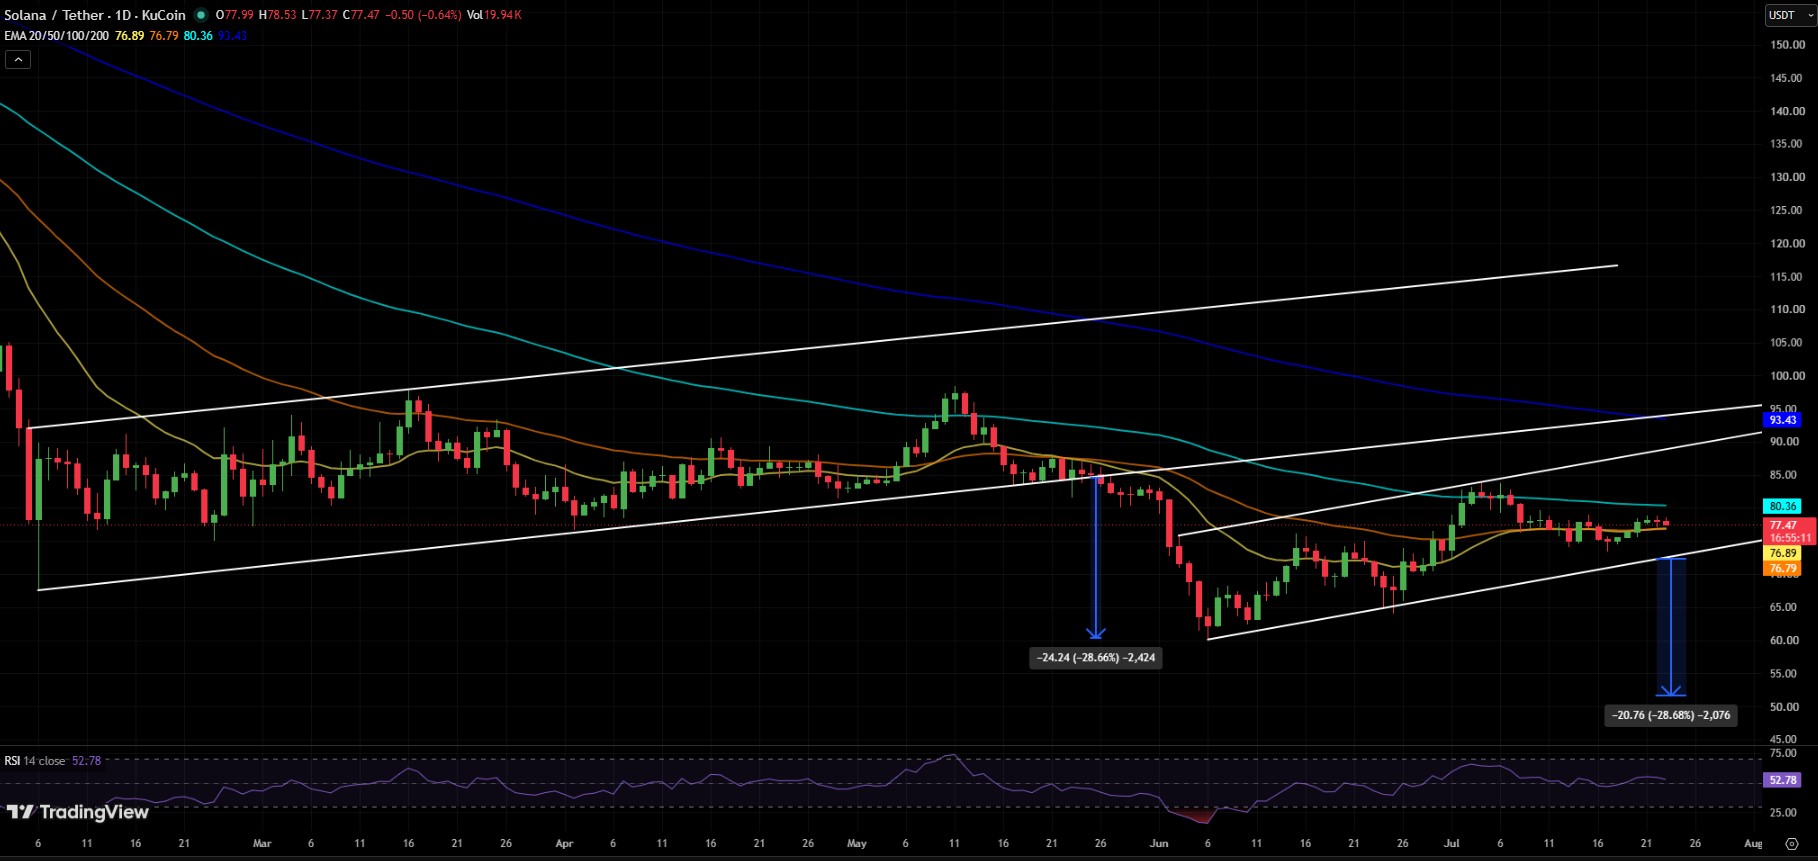
This is a measured-move technique — taking a completed leg's size and projecting the same percentage forward from a comparable technical position (in this case, a potential break of the channel's lower boundary). It's a common tool among technical traders, but it is a pattern-based projection, not a guaranteed outcome.
Disclaimer
This article is for informational purposes only and does not constitute financial advice. Cryptocurrency markets are highly volatile, and prices can change quickly. Always do your own research and consult a licensed financial advisor before making any investment decisions.
0
0

 すべての暗号通貨、NFT、DeFiを1か所から管理
開始に使用しているポートフォリオを安全に接続します。


0
0