
Celestia Price Prediction September 2026: Can $TIA Shine?

0
0

Celestia (TIA) is trading near $0.3515 at the time of writing, down 8.56% over the past 24 hours as the token slips back toward the lower end of its recent range.
The latest Celestia Price Prediction September 2026 outlook centers on a descending triangle that TIA has been trading inside for weeks.
The token broke out of that triangle earlier this month, touched resistance, and then failed to hold the move before sliding back inside the same structure, leaving the setup firmly in wait-and-watch territory.
TIA Price Today: Where Celestia Stands
According to the TradingView daily TIA/USD chart After its short-lived breakout above the descending triangle, $TIA has spent the past few sessions back inside the pattern it had briefly escaped.
Price is holding above the triangle's lower boundary for now, but momentum has faded from the highs reached during the breakout attempt.
Every close near the triangle's upper trendline is being watched closely by traders following the Celestia Price Prediction September 2026 narrative, since a confirmed close above that line and holding it is what would be needed to shift the structure meaningfully.
TIA Chart Structure: Descending Triangle in Focus
If TIA closes back above the triangle's upper trendline and holds that level, chart watchers see the move opening a path toward $0.4217, followed by $0.5215, and further out, $0.6258.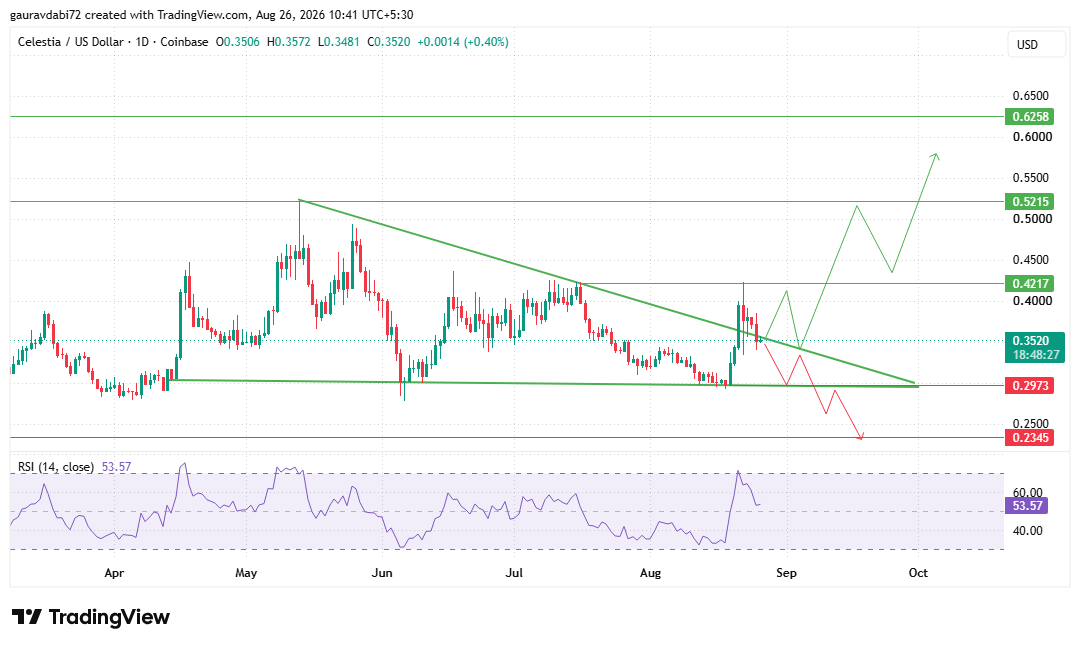
A close back inside the triangle instead points toward its built-in support levels at $0.2973 and $0.2345, with the price likely needing a few more weeks to establish direction either way.
The Relative Strength Index (RSI) on the daily timeframe is reading 53.57, just above the neutral 50 mark after recovering from a stretch below 40 earlier in the pattern.
That leaves the near-term Celestia Price Prediction September 2026 balanced rather than decisive: momentum has stabilized without yet building the kind of strength that would confirm a sustained move in either direction, based on the RSI reading on the daily chart.
Celestia Derivatives Snapshot: What the Data Shows
On the derivatives side, according to CoinGlass data, Celestia has posted a 7-day gain of 17.26%, a roughly flat 30-day change of 0.25%, and a 90-day decline of 19.98%, pointing to a token that bounced sharply in the short term after a weaker medium-term stretch.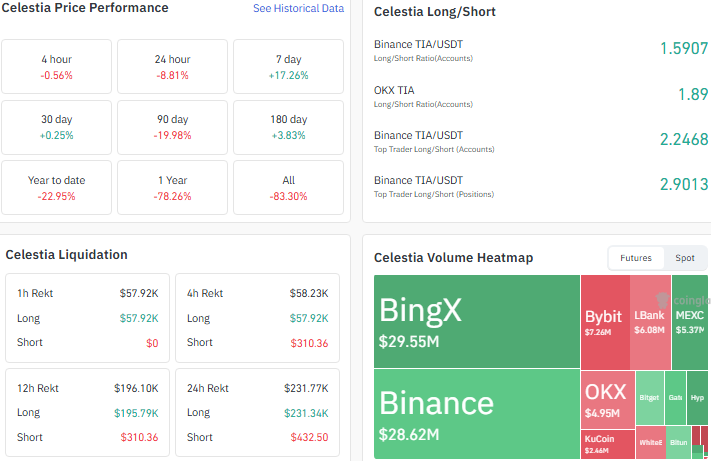
Trading volume on the 24-hour heatmap is led by BingX at around $29.55 million and Binance close behind near $28.62 million, with Bybit, LBank, and MEXC filling out the next tier.
Liquidations over the past 24 hours totaled about $231.77K, the large majority roughly $231.34K coming from long positions.
Long/short account ratios remain tilted toward longs, with Binance near 1.59 and OKX higher at 1.89, showing positioning still leans optimistic despite the pullback.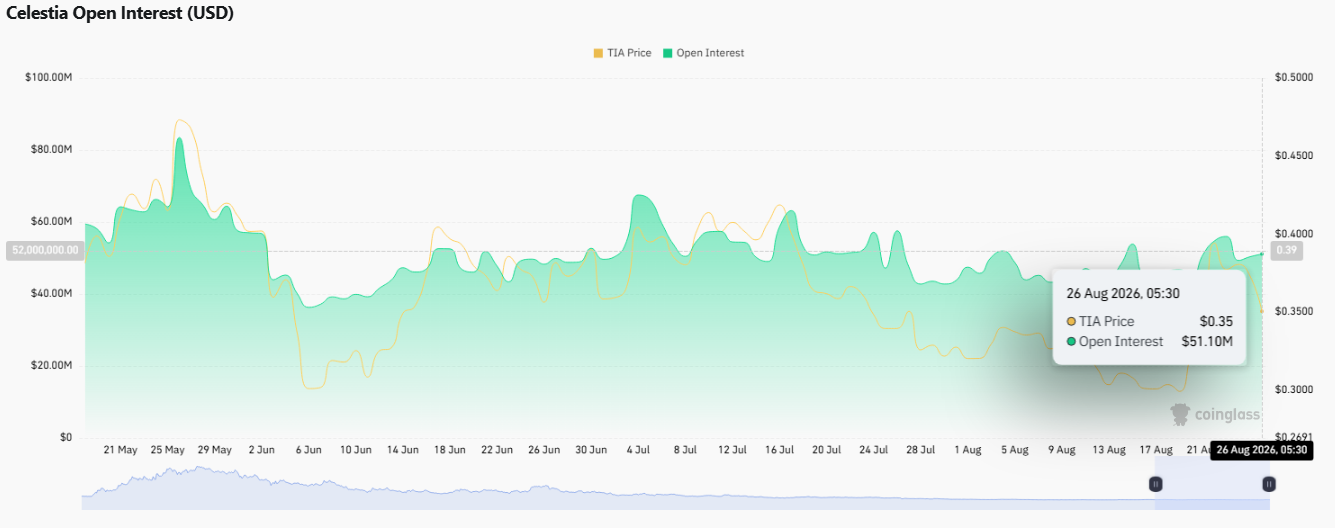
Open interest was last recorded near $51.10 million, holding within its recent multi-week range.
Celestia Market Capitalization: A Closer Look
Celestia currently carries a market capitalization of roughly $323.38 million, down 8.56% over the past day in step with the broader price pullback, according to CoinMarketCap data.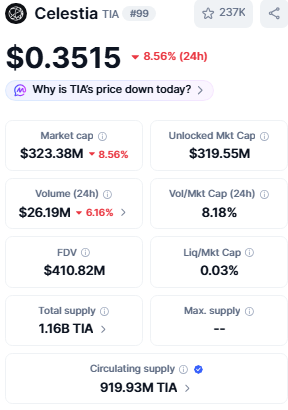
Fully diluted valuation stands near $410.82 million against a total supply of 1.16 billion TIA, with no fixed maximum supply reported.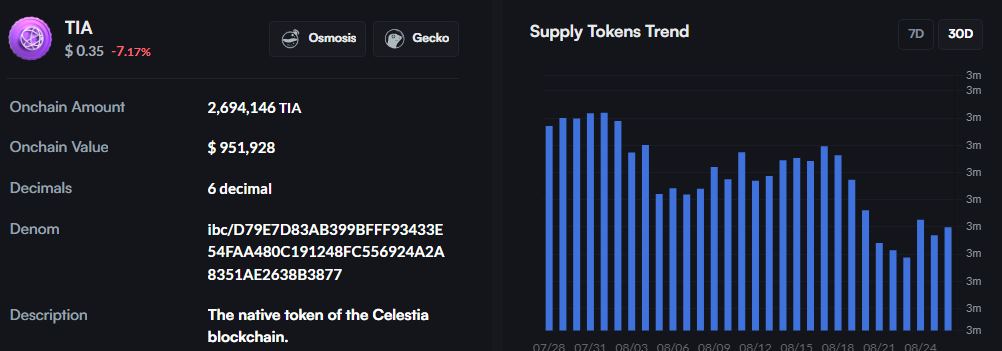
The circulating supply sits at approximately 919.93 million $TIA, and on-chain data via Mintscan shows the IBC-bridged $TIA supply on Osmosis has trended lower over the past 30 days, tracking the broader cooldown in on-chain activity.
Bull, Neutral, and Bear Case for Celestia Price Prediction September 2026
Scenario | What It Would Take |
Bullish Case | A daily close back above the triangle's upper trendline that holds, opening a path toward $0.4217 and, if momentum extends, $0.5215 and $0.6258. |
Neutral Case | Price continues oscillating inside the descending triangle, extending the current wait-and-watch phase for a few more weeks without a decisive break either way. |
Bearish Case | A close back inside and below the triangle's support opens the way toward $0.2973, with $0.2345 as a deeper level if selling pressure builds. |
Disclaimer: This article is for informational purposes only and does not constitute financial, investment, or trading advice. Cryptocurrency markets are highly volatile and unpredictable; readers should conduct their own research before making any decisions. CoinGabbar and the author bear no responsibility for losses incurred based on this content.
0
0

 Beheer al jouw cryptovaluta, NFT en DeFi vanaf één plek
Verbind de portfolio die je gebruikt veilig om te beginnen.


