
Bitcoin, Ethereum, and XRP Prices Up Today? What's Driving the Rally?

0
0

The crypto market is green today. Traders are watching a busy week of events that could shape prices for weeks to come.
Bitcoin trades near $79,700, up 1.5%. Ethereum holds above $2,500, up 1.66%. The XRP price is up 3.84%, trading close to $1.44.
Behind the calm gains, five big events are lining up back-to-back. Each one could move the market fast.
What Crypto Events Are Happening This Week?
Traders have a packed calendar ahead. Here is what to watch.
September 10 – PPI data. A hot number could push the Fed toward a hawkish stance.
September 11 – CPI data. July's reading was 3.4%. Another hot print would support a rate move.
September 15 – Clarity Act procedural vote in the Senate.
September 16 – Fed rate decision.
September 18 – Bank of Japan decision, which could ripple into risk assets like bitcoin.
What Are the Odds of a Fed Rate Hike on September 16?
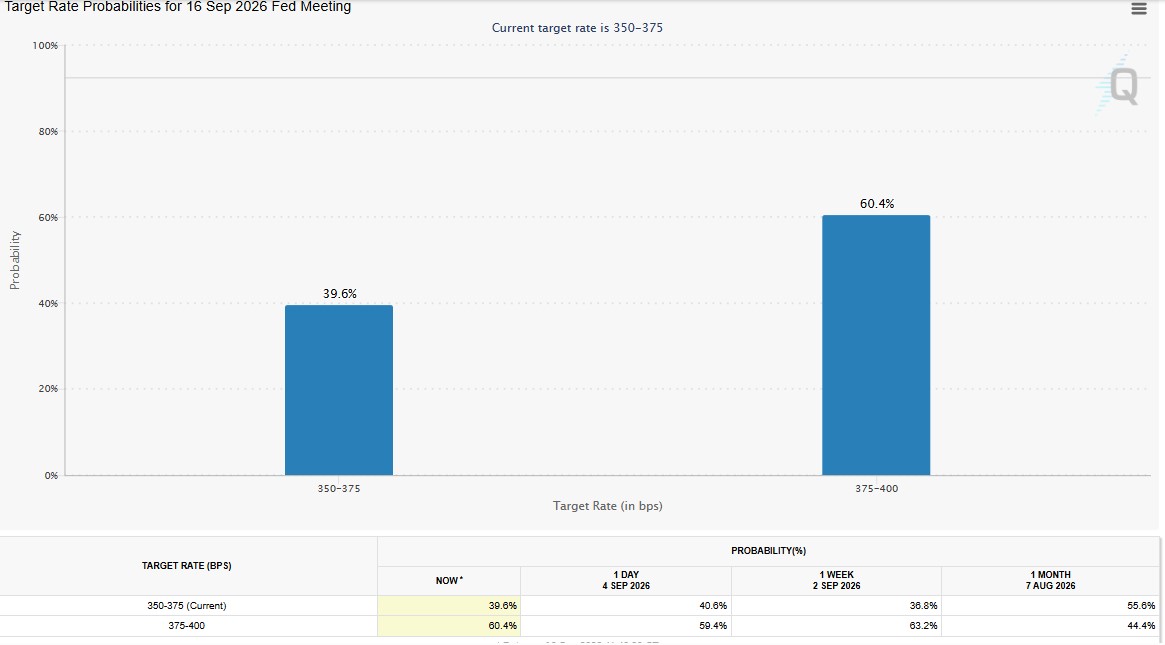
Markets currently price a 60.4% chance the Fed raises its target rate to 375-400 basis points. That is up from 39.6% odds of holding steady. A week ago, the split was 63.2% versus 36.8% in favor of the hike.
Target Rate (bps) | Now | 1 Week Ago | 1 Month Ago |
350-375 (current) | 39.6% | 36.8% | 55.6% |
375-400 | 60.4% | 63.2% | 44.4% |
Is the Crypto Market Feeling Greedy Right Now?
The Crypto Fear & Greed Index sits at 66 today, in the Greed zone. Yesterday it was 69. Last week it read 63.
A month ago, the score was just 30, deep in Fear territory. Sentiment has clearly shifted since then.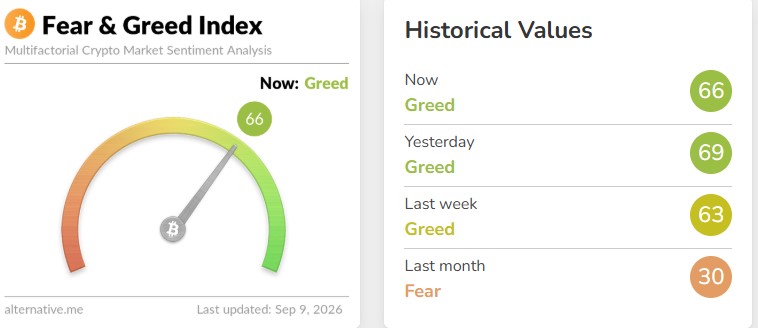
How Much Crypto Was Liquidated in the Last 24 Hours?
According to CoinGlass data, 76,916 traders got liquidated in the past day. Total liquidations hit $228.77 million.
The biggest single order was a $2.96 million BTCUSDT liquidation on Binance.
Short positions made up $111.98 million of the total. Long positions accounted for $116.75 million.
Bitcoin led with $70.56 million liquidated, followed by Ethereum at $47.78 million and Zcash at $12.50 million. Over just the last hour, $13.71 million was wiped out, a sign of ongoing volatility.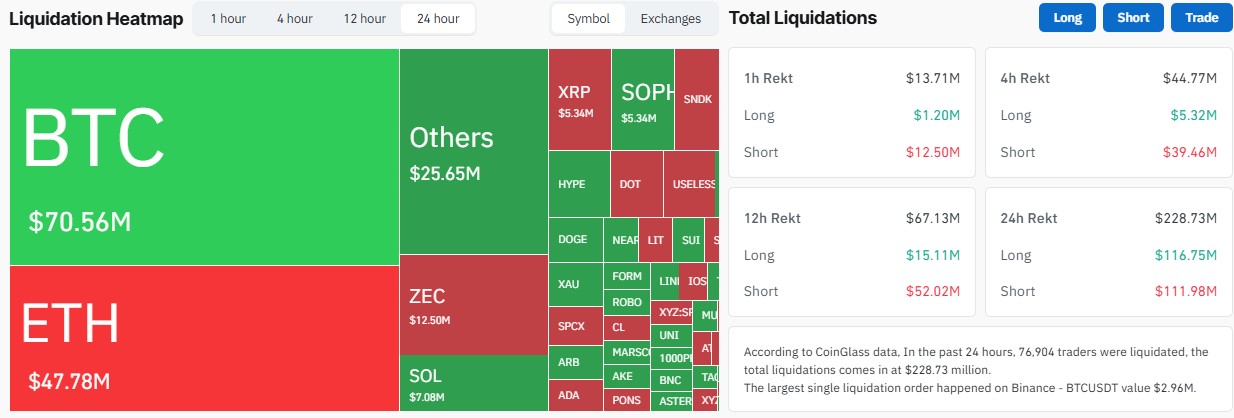
Bitcoin and Ethereum ETFs Seeing Outflows, While XRP Shows Inflow
U.S. spot Bitcoin ETFs saw net outflows of $46.6 million on September 8, based on SoSoValue data. That snapped a three-day inflow streak.
Ethereum ETFs also saw outflows, totaling $24.3 million total. Fidelity's FETH bucked the trend with $9.9 million in inflows.
XRP ETFs told a different story. They pulled in $1.55 million, led entirely by Franklin's XRPZ fund.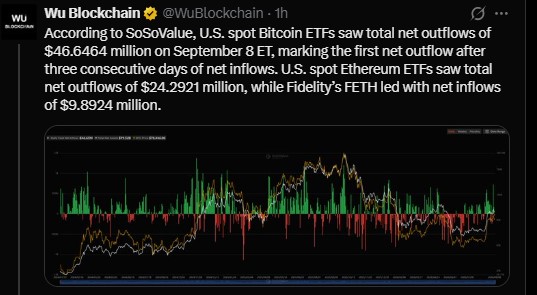
Bitcoin Price Forecast: $100K or Back to $50K?
Bitcoin sits at a crossroads. A weekly close above $83,000 would keep the path to $100,000 open.
That case leans on a Golden Cross formation, a reclaim of the Warm Supply Realized Price, and MACD cycle symmetry.
The last Golden Cross came before bitcoin surged more than 500%. But spot demand looks softer this cycle.
On the other side, a break below $76,000, combined with a hawkish Fed and a delayed Clarity Act, opens the door to a drop toward $50,000.
Some analysts flag a bearish AMD pattern, short for Accumulation, Manipulation, Distribution. Under this view, BTC accumulated between $58,000 and $67,000, then pushed to $80,000 in what could be a manipulation phase rather than a breakout.
This thesis allows for a run to $88,000-$92,000 before a possible reversal back toward $50,000, especially if the Clarity Act slips into 2030.
Bitcoin also just reclaimed its Warm Supply Realized Price, the average cost basis of coins that last moved between one week and six months ago. The last four reclaims of this level came before rallies of 69%, 159%, 74%, and 34%.
What Are Bitcoin's Fibonacci Price Targets?
Target | Fibonacci Level |
~$96,000 | Fib 0.702 |
~$104,000 | Fib 1.272 |
~$129,000 | Fib 1.414 |
~$175,000 | Fib 1.618 |
$215,000-$384,000 | Higher-cycle expansion |
RSI is showing lower highs at each recent peak, a bearish divergence. That setup only activates on a confirmed break below $76,000. A push above $84,000 would weaken it.
Exchange balances have risen by about 45,000 BTC since May 11, normally a bearish signal. But price didn't follow the usual script this summer, falling to $58,562 in June before climbing back near $78,700.
Ethereum Price Prediction: Will ETH Hit $3,000 Next?
Ethereum broke above $2,400 and has been consolidating above that level instead of running higher right away. That gives the market room to build liquidity.
$3,000 is viewed as the next obvious target. If ETH clears it with momentum, $3,700 becomes the area to watch after that.
On the 4-hour chart, ETH/USDT is forming a bull flag, with repeated tests of the $2,515-$2,525 resistance zone and higher lows forming underneath.
Price holds above the 20/50/100/200 EMAs, and RSI near 59.6 suggests bullish momentum without being overbought.
A strong 4-hour close above $2,525 could open a move toward $2,700-$2,750. Losing $2,490 risks a pullback to $2,470, and a break below $2,420 would weaken the bullish case.
XRP Price Prediction: Is a Breakout Coming?
The XRP price accumulation score remains strong at 93, according to on-chain trackers.
XRP is trading close to the upper line of its accumulation zone. That raises the odds of a breakout followed by a fresh upward move.
MACD and EMA readings both point to bullish momentum building.
Why Does XRP's Weekly Gaussian Channel Matter?
XRP's weekly Gaussian Channel has historically marked major macro buying zones whenever price sweeps below its lower boundary. XRP remains below that level today.
This pattern has appeared only seven times in 13 years. Every prior instance preceded a major repricing event in 2014, 2017, 2020, 2022, and 2024.
XRP's weekly Supertrend indicator has also flipped bullish. In 2022, the same signal fired after the cycle bottom and led to a 90% run into the 50-week EMA, before a 45% correction back to a double bottom.
This year, the signal fired on August 17, and price has already reached the same 50-week EMA resistance zone near $1.52. If history repeats, a rejection here could offer another buying opportunity before the next leg up.
Why Are Traders Talking About a $60 XRP Target?
Analyst Ali Martinez has pointed to what he calls a massive ascending triangle on XRP's monthly chart, a pattern he says has been building for nearly ten years.
He flags $3.66 as the key resistance level. A monthly close above that price would confirm the breakout and open a technical target near $60.
That would require the XRP price to more than double from current levels just to test $3.66 first. The $60 figure remains a long-term technical projection, not a promise.
On shorter time frames, Martinez has also flagged a descending triangle on the hourly chart. An hourly close above $1.40 could trigger a smaller move toward $1.46.
Short-term charts point to a possible move toward $1.80-$2.30 if resistance breaks. The long-term triangle target near $60 stays far off unless $3.66 clears first.
Disclaimer
This article is for informational purposes only and does not constitute financial, investment, or trading advice. Cryptocurrency markets are highly volatile and carry significant risk. Prices mentioned are approximate and subject to change. Always do your own research and consult a licensed financial advisor before making investment decisions.
0
0


 从同一位置管理所有加密资产、NFT 和 DeFi 资产
安全地关联您正在使用的投资组合,以开始交易。


