Notcoin: Is This the Dip Before the Rip? Technical Indicators Say Maybe

0
0

- NOT Coin down 20% this week; potential rebound on the horizon.
- RSI near oversold territory at 34, signaling possible price bounce.
- Bullish MACD crossover suggests upward momentum for NOT Coin.
Notcoin, the Telegram-based cryptocurrency, has tumbled more than 20% in the past week, but technical indicators suggest the digital asset could be nearing a rebound. Despite the recent decline, the cryptocurrency’s Relative Strength Index (RSI) and Moving Average Convergence Divergence (MACD) are signaling potential for an upward price movement.
The Relative Strength Index (RSI) for Notcoin on the 4-hour chart currently sits at 34, indicating that the asset is approaching oversold territory. This suggests the possibility of a price rebound if this trend continues. Typically, an RSI below 30 signifies an oversold condition, while an RSI above 70 indicates an overbought condition.
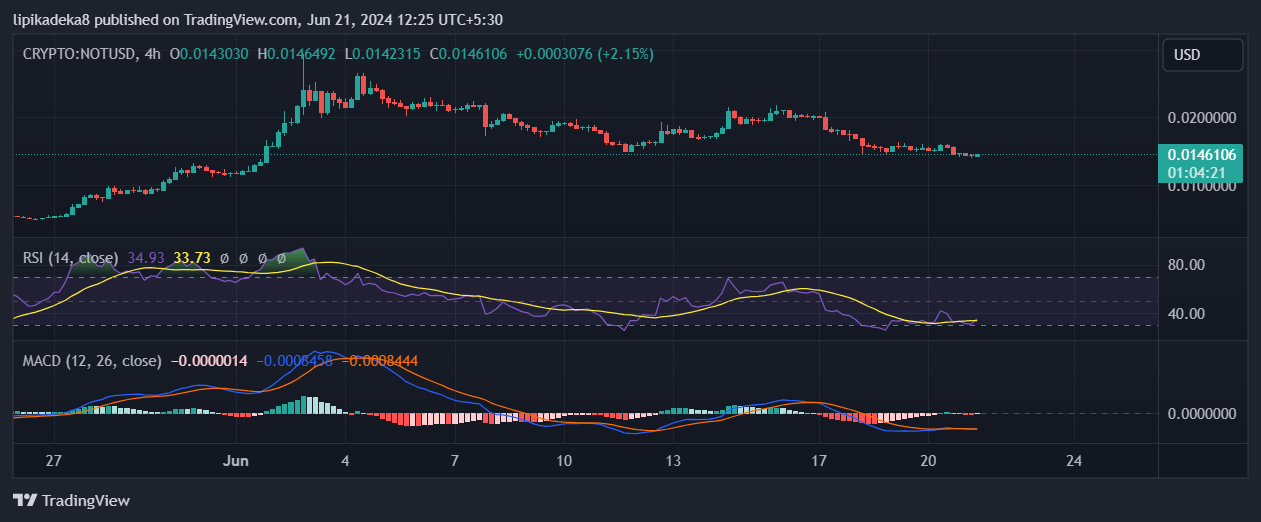
The Moving Average Convergence Divergence (MACD), depicted by the blue line, has crossed above the signal line (orange line), signaling a bullish crossover in the short term. This suggests potential upward momentum for Notcoin.
On the price front, Notcoin has been on a downtrend, losi…
The post Notcoin: Is This the Dip Before the Rip? Technical Indicators Say Maybe appeared first on Coin Edition.
0
0

 Tüm kripto, NFT ve DeFi varlıklarınızı tek bir yerden yönetin
Kullanmaya başlamak için portföyünüzü güvenli bir şekilde bağlayın.


