5 Best Crypto Screeners for Market Overview and Detailed Research in 2026

Key Takeaways
- Crypto screeners help traders and investors filter thousands of cryptocurrencies to identify potential opportunities.
- CoinStats Crypto Bubbles and Heatmap provide quick visual overviews of market trends, price movements, and market capitalization.
- TradingView offers advanced technical filters and charting tools for detailed cryptocurrency research.
- DEX Screener helps discover and analyze newly listed tokens using liquidity, trading volume, and transaction data.
- altFINS offers preset technical scans, chart pattern detection, and alerts to identify potential trading setups.
The mainstream aggregate trackers list over 22,000 cryptocurrencies. There are many more in reality. Nobody can watch that many, and most of them are noise. A crypto screener cuts the list down to what deserves your attention today within seconds.
This guide covers five crypto screeners, grouped by the job each one does best. Some show the whole market at a glance. Others help you dig into a single coin.
Long story short, the best crypto screener depends on the job. For a quick read of the whole market, use a visual tool like CoinStats Crypto Bubbles. For deeper research, use a filter-based screener such as TradingView or Messari, then check on-chain data in DefiLlama or DEX Screener. Most people need one tool of each type.
What is a crypto screener?
A crypto screener is a web tool that filters coins by rules you set, such as market cap, trading volume, price change or technical indicators. It works like a stock screener. Instead of checking thousands of coins by hand, you narrow the list to a few that fit your criteria.
A crypto screener helps you narrow a large set of assets using criteria such as price change, market capitalization, trading volume or technical indicators. A visual crypto screener, like heatmaps and bubbles, makes patterns easier to spot, while a filter-based screener returns assets that meet your chosen rules.
You need both types of screeners. The visual overview screener tells you where to look. The deep research screening tool tells you if it is worth your time.
What to look for in a crypto screener?
Look for clear data, filters that match your goal and numbers you can verify. Overview tools should show what size and color mean and let you change the timeframe. Research tools should filter by more than price, save your screens and make liquidity easy to check.
For market overview tools, check for:
- Click-to-expand functionality
- Several timeframes (hourly, weekly, monthly, yearly)
- Category and rank filters
- Fast refresh and no login wall
For research tools, check for:
- Sophisticated filters like on-chain activity and technical indicators
- Large asset coverage that fits what you trade
- Clear definitions of technical terms
- Saved screens and exports
For developers and advanced users who want to build custom screening tools, the CoinStats API provides programmatic access to cryptocurrency market data for creating personalized dashboards and research workflows.
1. CoinStats Crypto Bubbles: Best for a fast read of the whole market
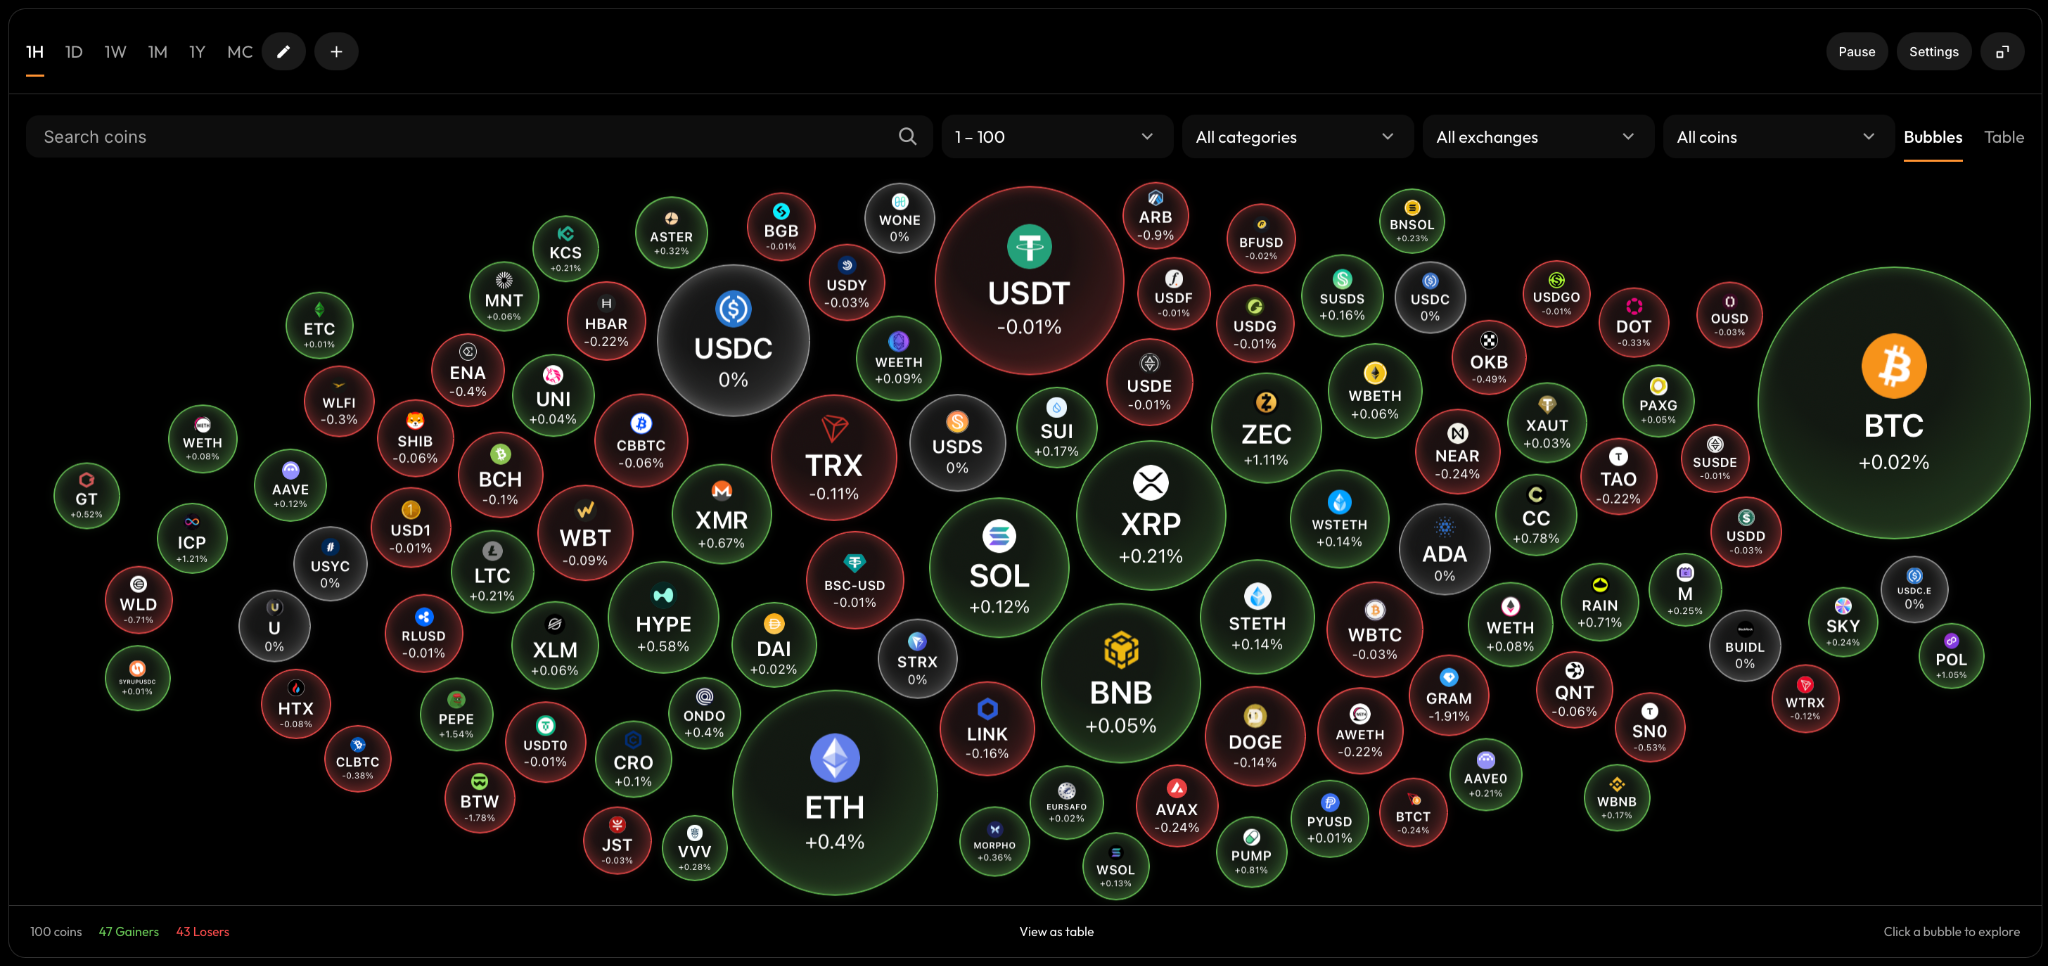
Crypto Bubbles turns the market into a bubble chart. Each coin is a bubble. Size shows market cap by default, and you can switch it to 24-hour volume or absolute price change. Color shows direction, green for gains and red for losses over the timeframe you pick.
Notably, the data refreshes about once a minute, and the tool is free with no account.
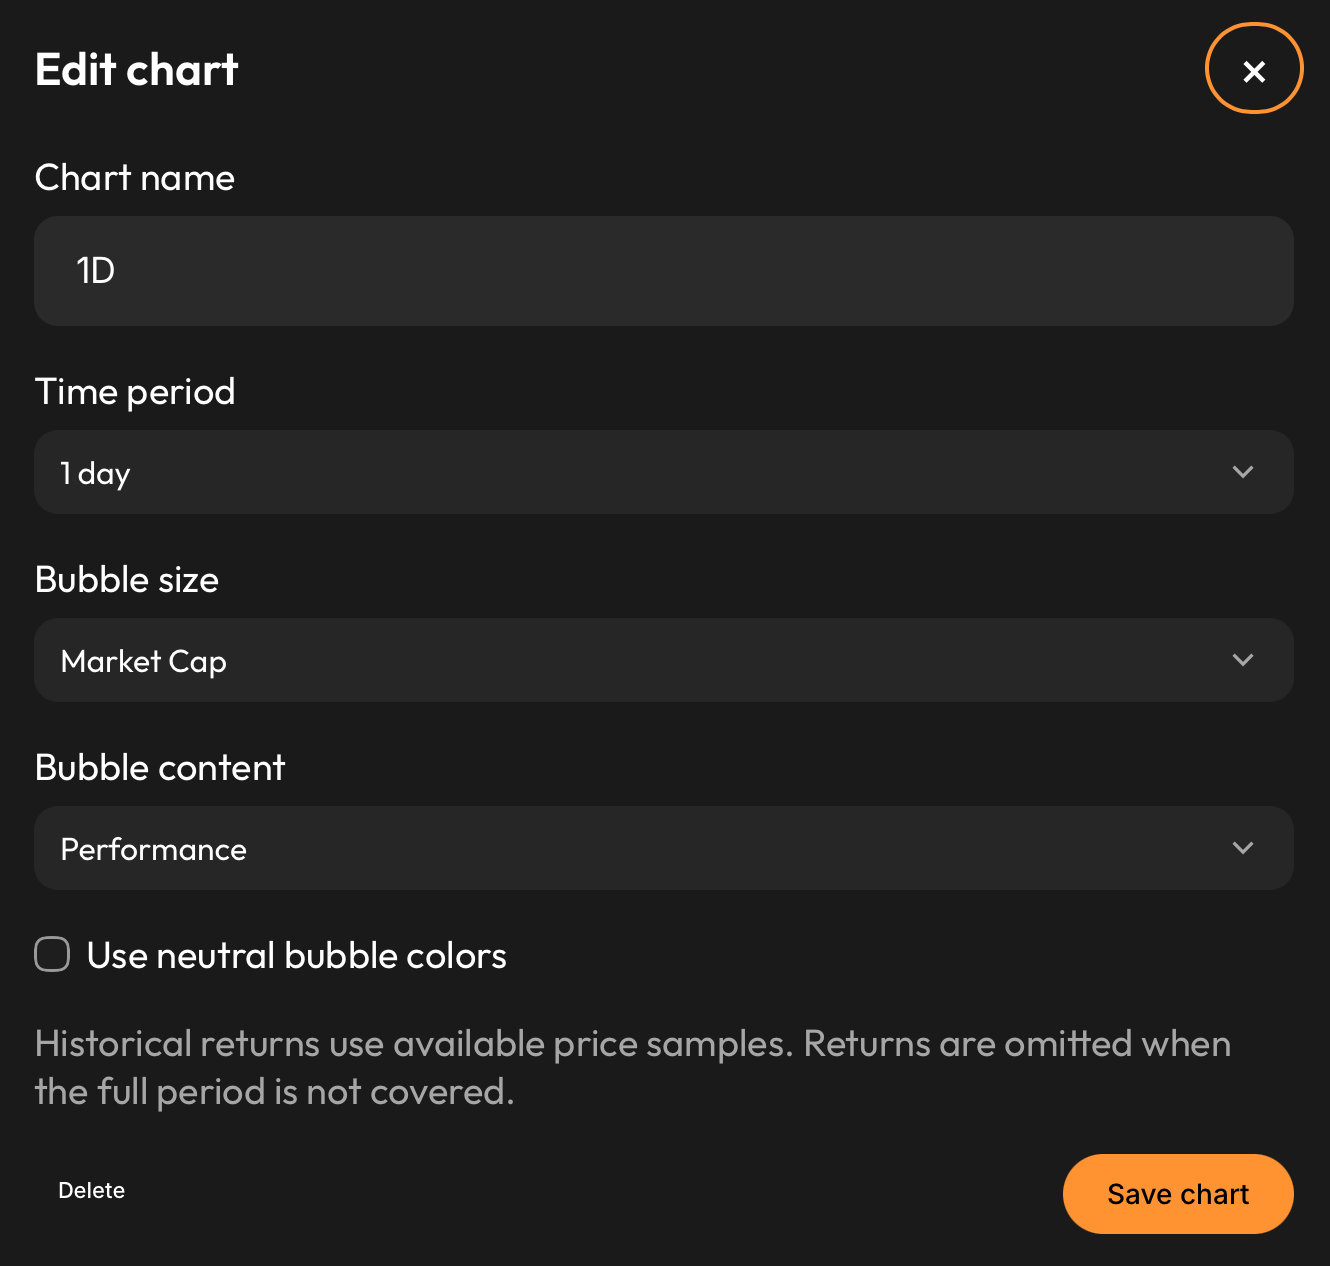
Presets run from one hour to one year. You can filter by category, exchange and rank band, search for a coin and keep a local watchlist.
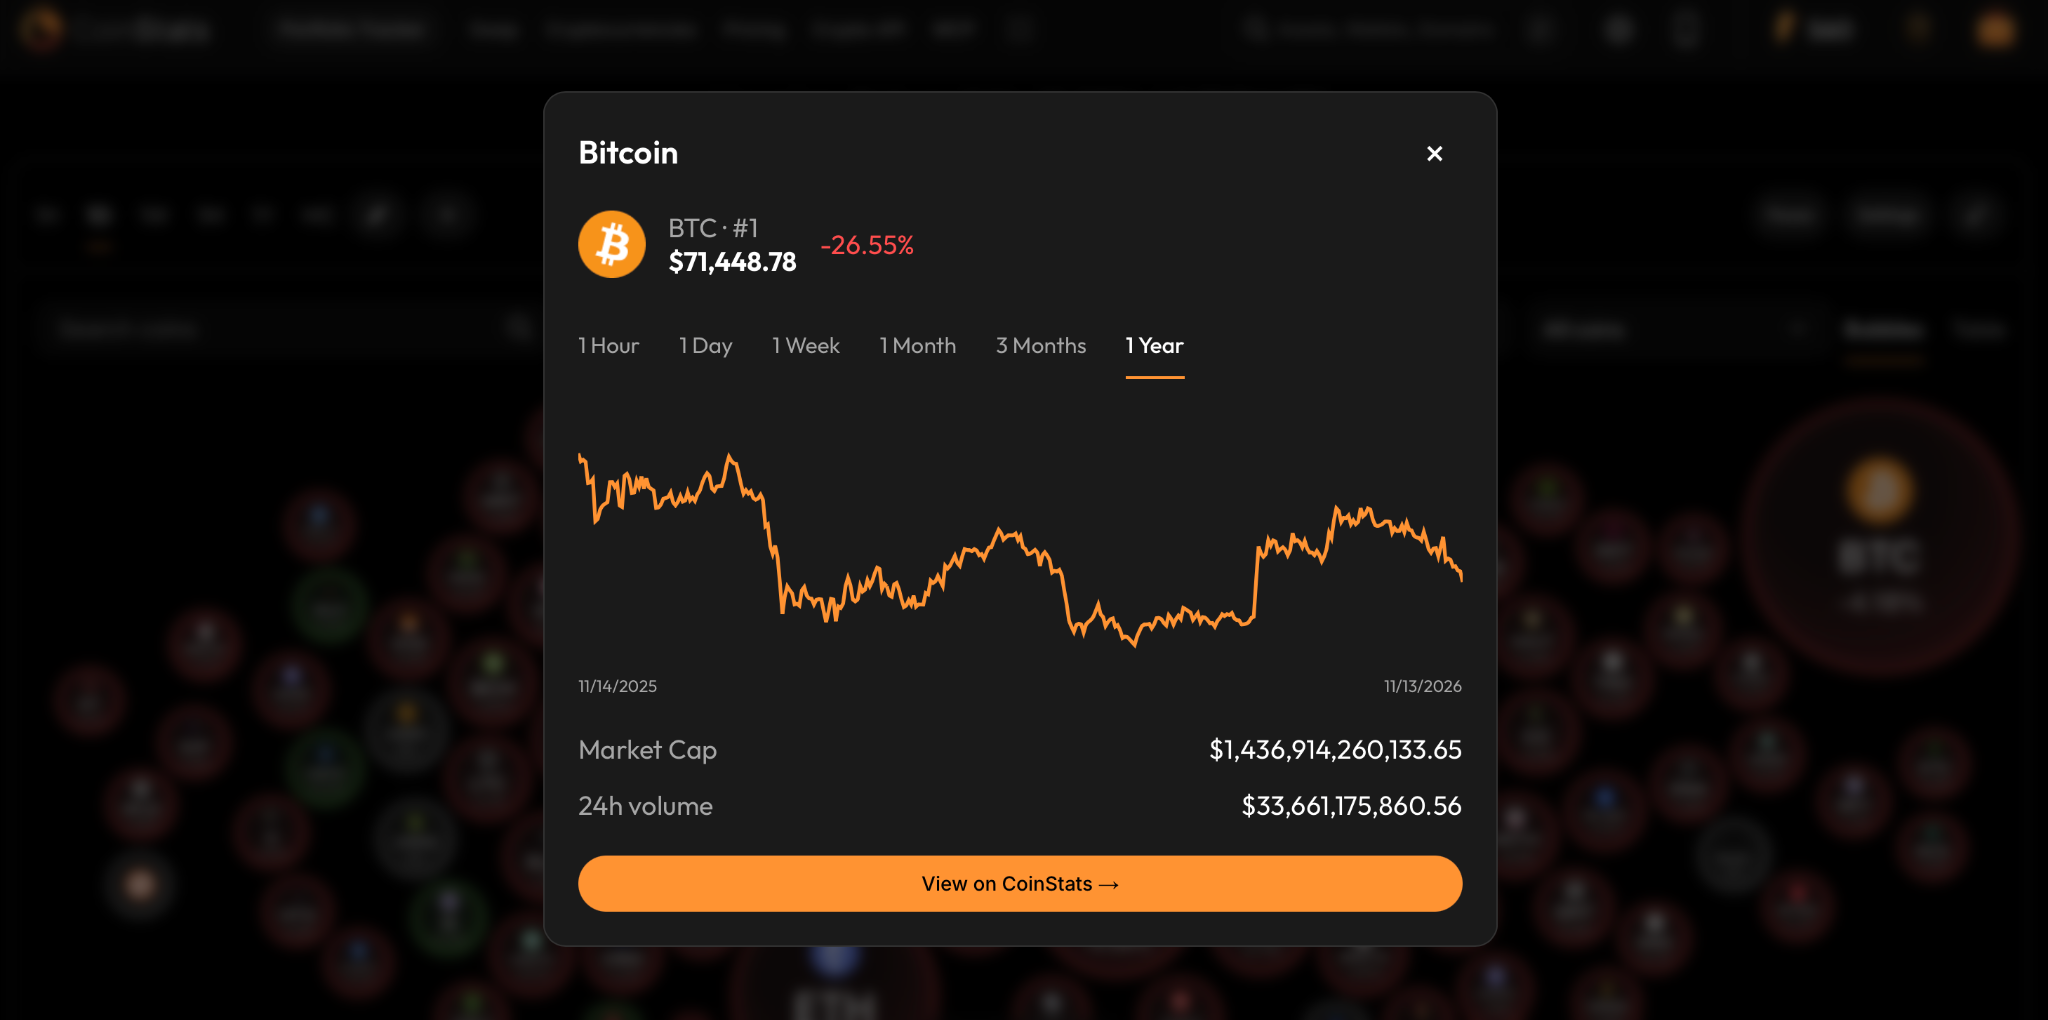
A table view lists price, market cap, volume and changes, plus the top 24-hour gainers and losers. Click a bubble to see that coin’s price, volume and history.
If you’d like to dig deeper, you can click on any bubble and open more coin data.
2. CoinStats Heatmap: Best for relative market cap visualization
Market cap is critical indicator for many longer term crypto investors. Generally, higher market cap assets have lower volatility. The CoinStats Heatmap does a fantastic job at helping users visualize the market cap of cryptocurrencies relative to other assets.
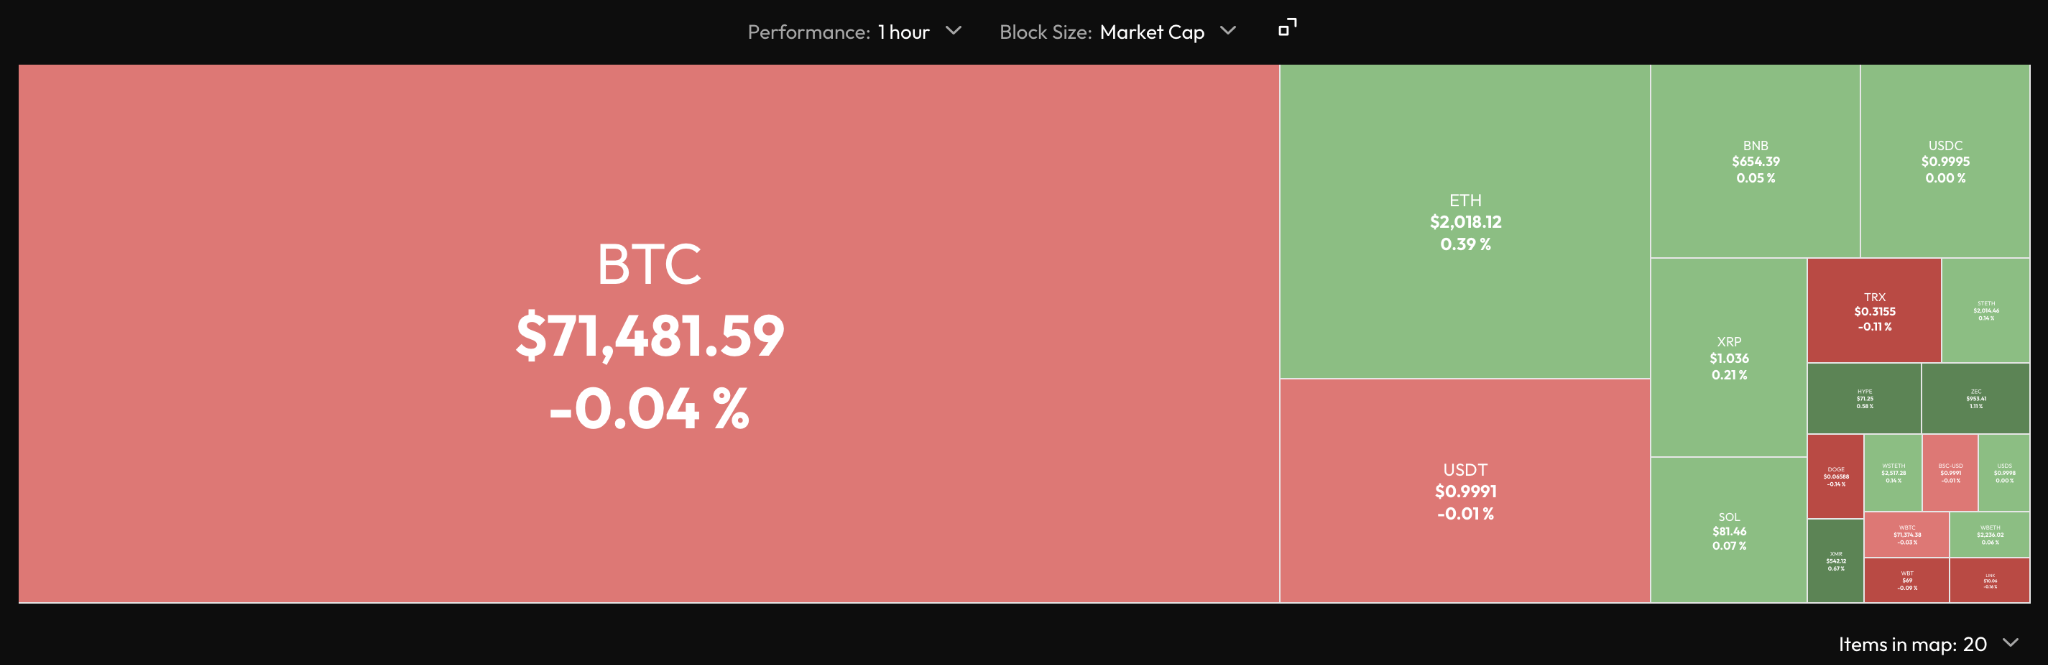
It works best as a quick daily scan. You see which large coins are leading or lagging in a few seconds, without opening a table. Use it for the one-day picture, then switch to Crypto Bubbles when you want longer timeframes, category filters and a table view.
You can hover over any block to see more information about that cryptocurrency and click on it to go to the detailed information page.
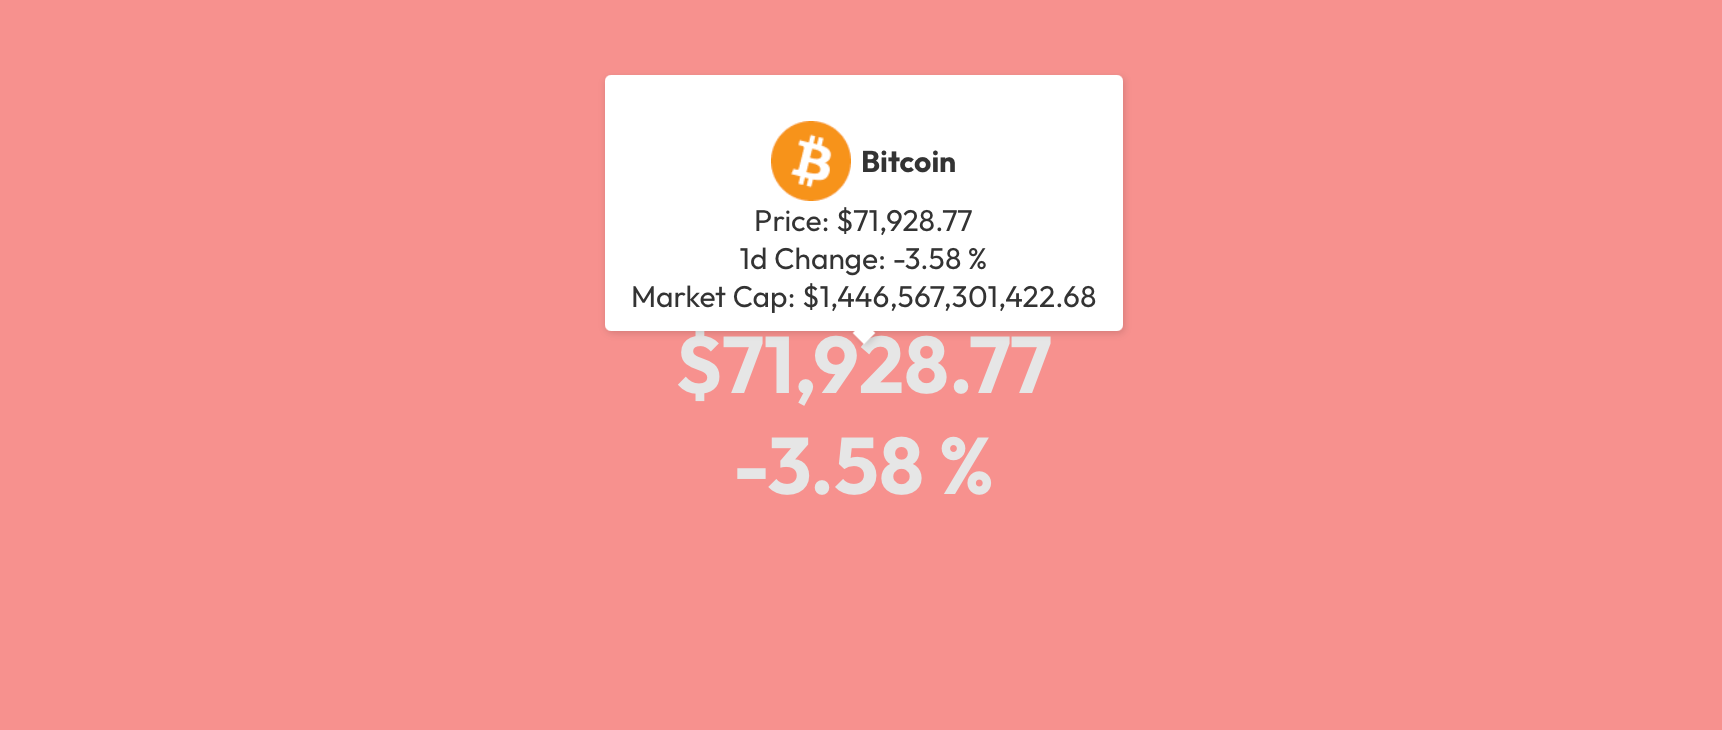
Like any heatmap, it shows how prices moved, not why. Pair it with a research screener before you act on what you see.
3. TradingView Crypto Coins Screener: Best for technical filters and chart analysis
TradingView Crypto Coins Screener suits people who want to define specific conditions and inspect the resulting charts. The screener includes price, volume, valuation and technical filters, with indicators such as the Relative Strength Index (RSI) and moving averages. You can save screens and customize the data table.
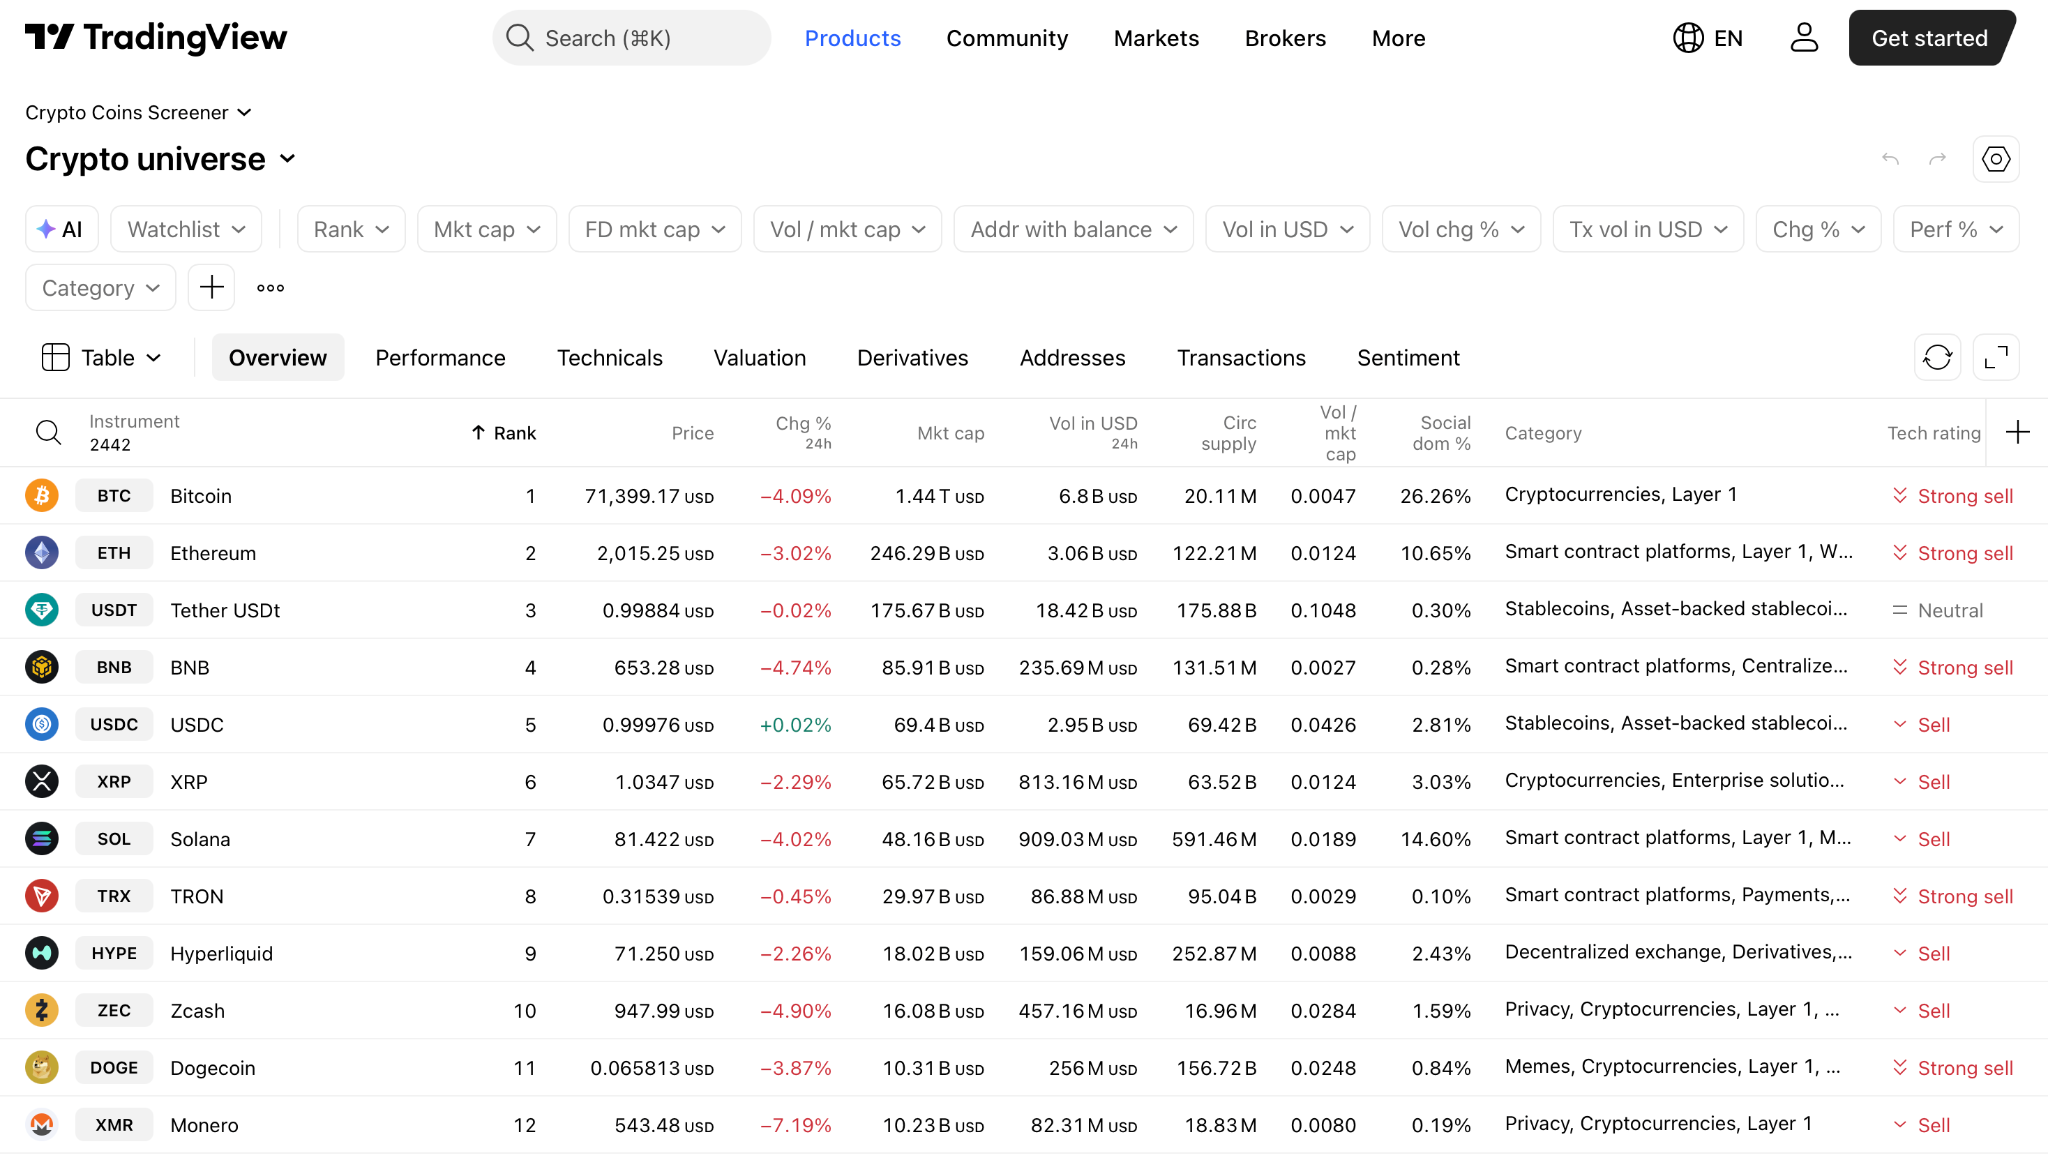
For example, you might shortlist coins trading above a longer-term moving average, then inspect whether their recent price action supports your research idea. This creates a repeatable way to search without checking every chart manually.
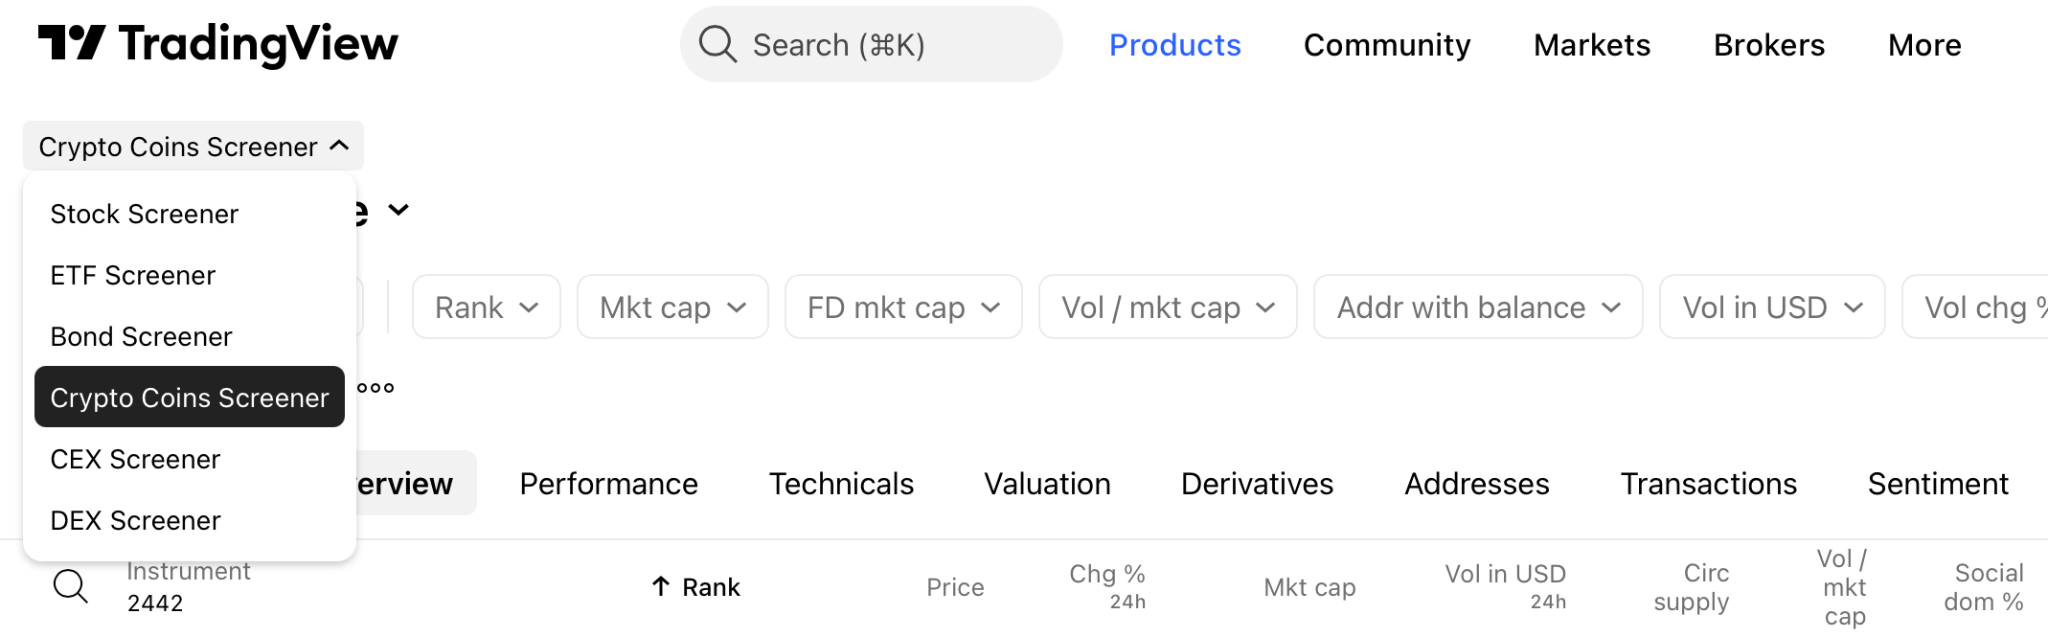
Choose the appropriate TradingView screener. Crypto Coins Screener compares aggregated asset data. CEX Screener focuses on markets at centralized exchanges, while DEX Screener focuses on decentralized exchange pools.
4. DEX Screener: Best for finding new tokens on DEXs
DEX Screener is useful for researching tokens traded on decentralized exchanges. Its public interface shows pairs alongside price changes, pool age, transactions, volume and liquidity. That makes it useful for investigating where a token’s trading activity is happening.
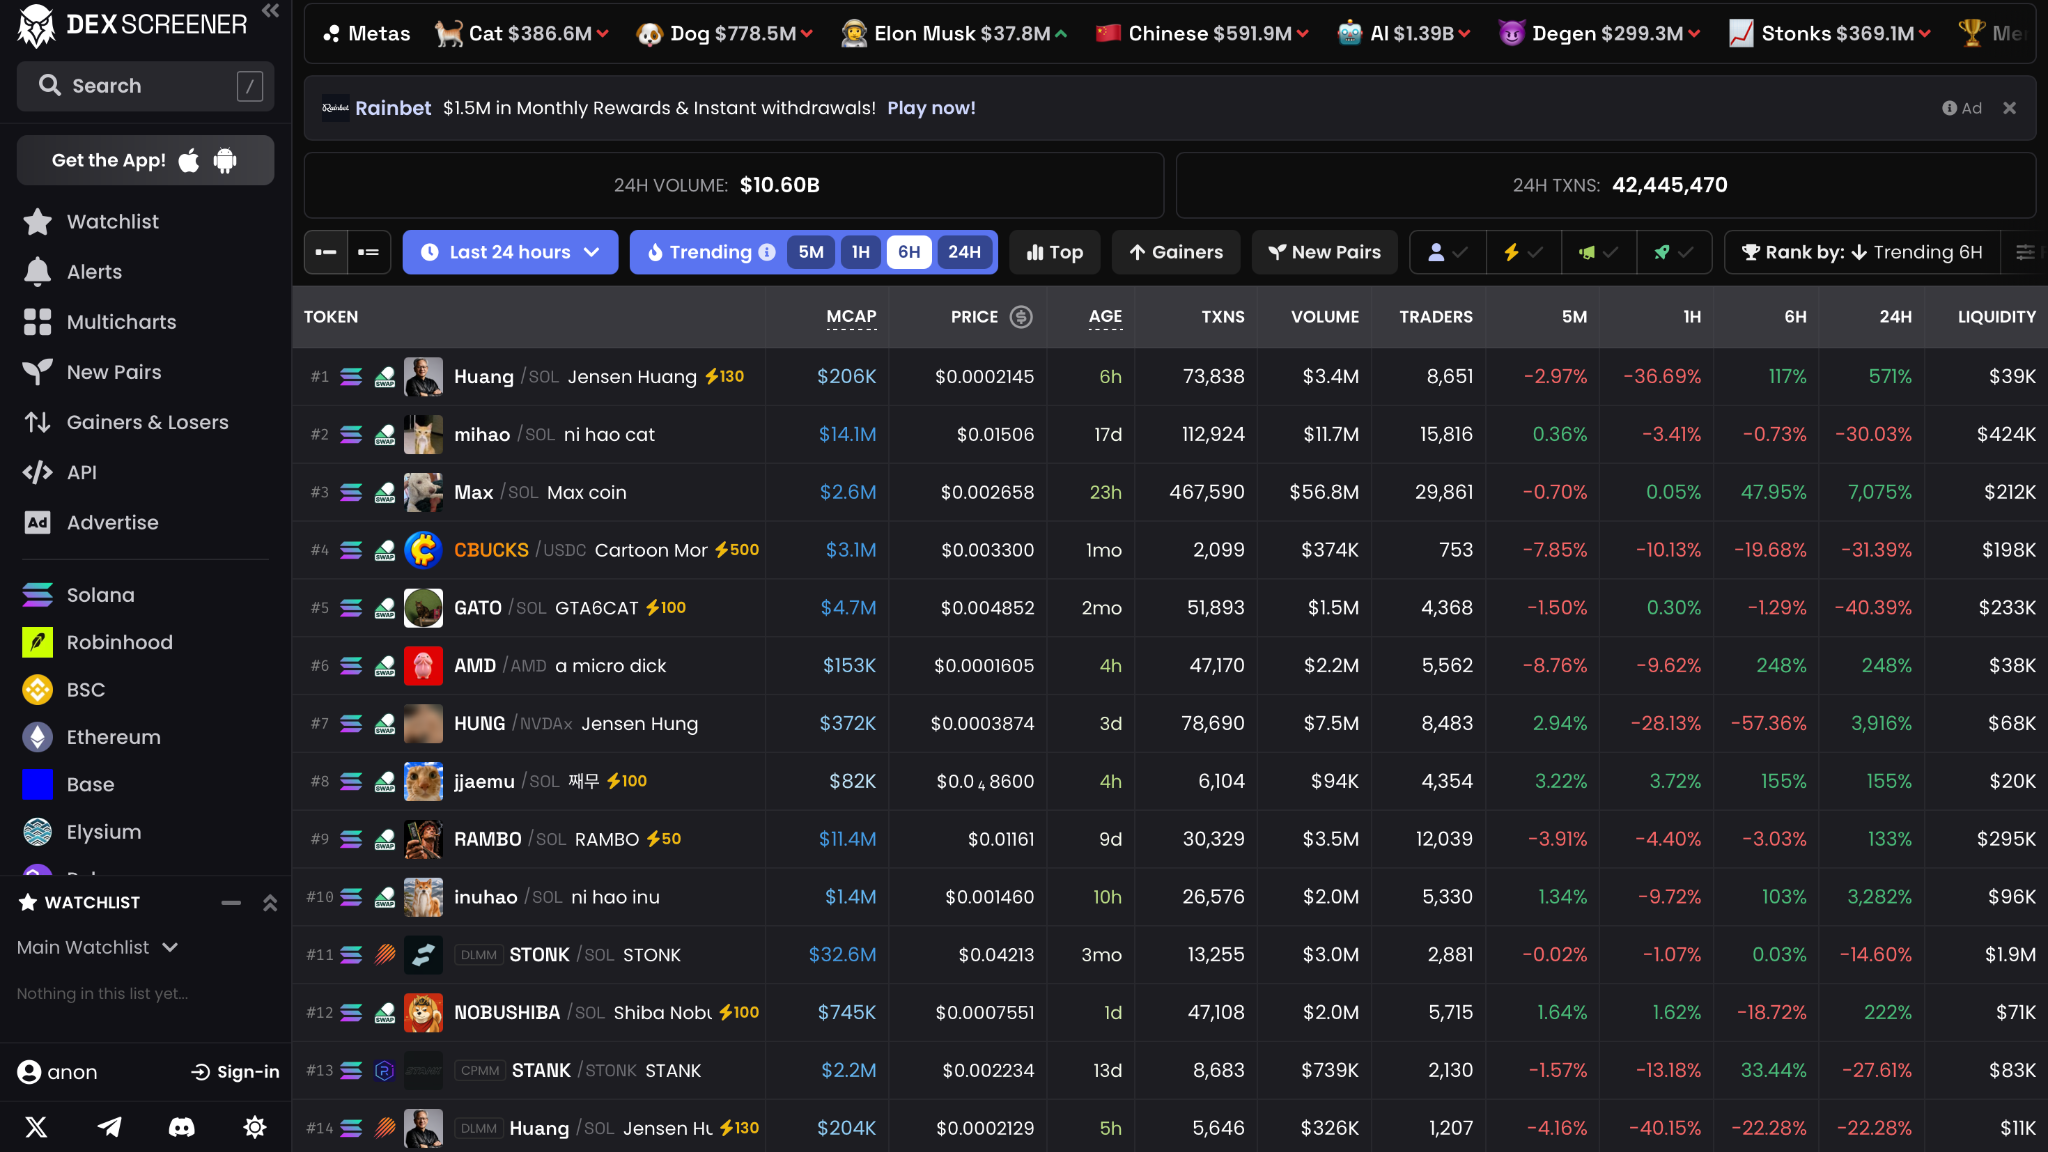
Search using the verified token contract address and check the network and pool. Tokens can share names or tickers, and one token can trade in several pools. Examine the specific pool relevant to your research.
Note that DEX Screener lists tokens automatically after they enter a liquidity pool and record a transaction. It also sells Boosts that can increase a token’s Trending Score. A listing is therefore not a quality assessment, and trending placement can reflect paid promotion.
5. altFINS Crypto Screener: Best for preset technical scans and chart patterns
The altFINS crypto screener is built for traders who want setups based on technical analysis. It scans more than 2,000 coins across 30+ exchanges. It offers over 130 indicators, including SMA, EMA, RSI and MACD, calculated across five timeframes from 15 minutes to 1 day.
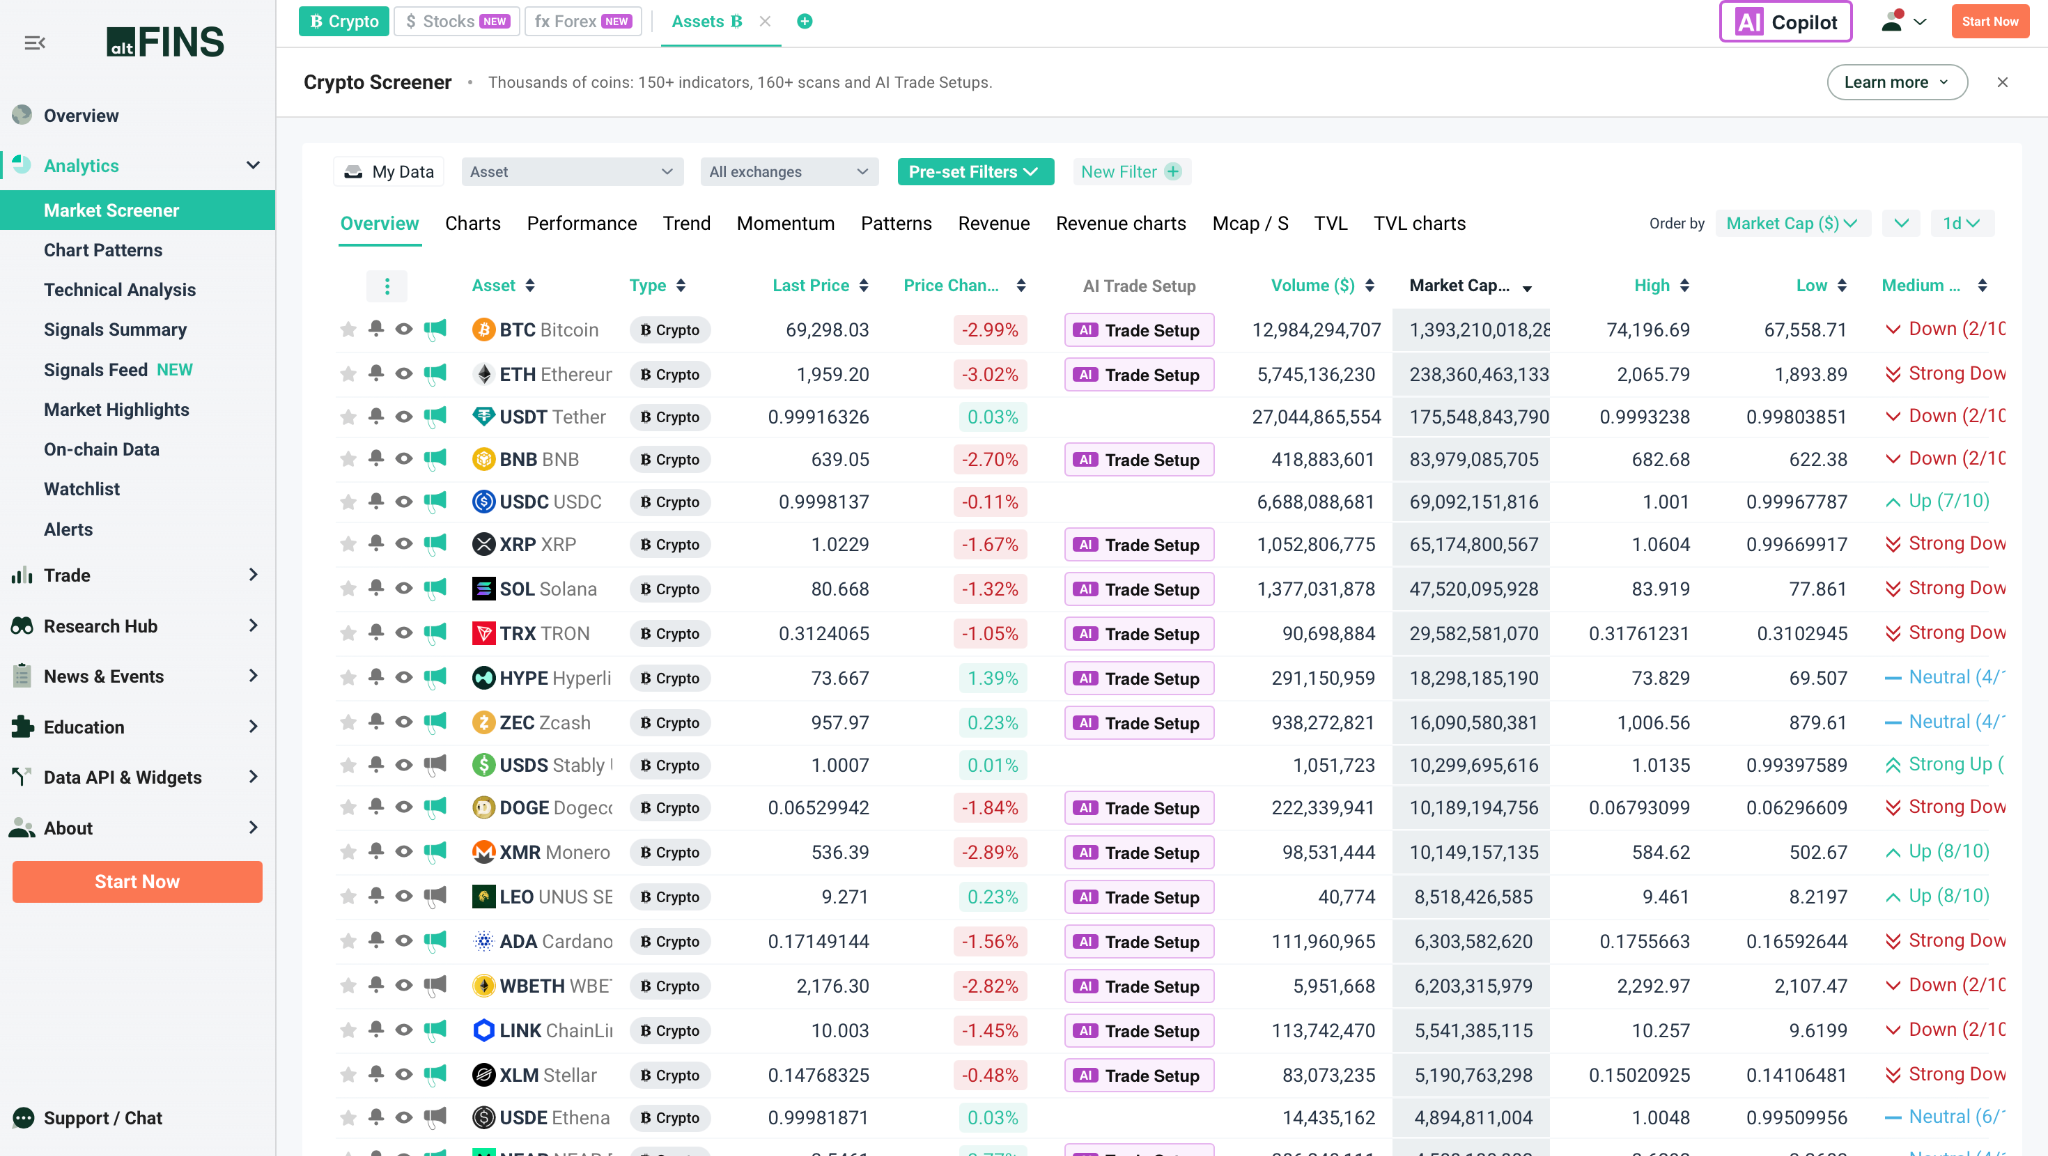
Most of the work is already done for you. The tool has 160+ preset scans, such as Strong Uptrend, Pullback in Uptrend, Oversold (RSI) and EMA crossovers, and each runs in one click. You can also combine indicators into your own screen. Beyond indicators, it detects 35+ chart patterns and 30+ candlestick patterns, and has filters for fundamentals such as revenue, TVL and valuation ratios, plus on-chain data.
You can save a scan and turn it into an alert. When a new coin matches, you get notified by email, push or web. altFINS has a free Starter plan with the technical screener, basic AI chart-pattern detection and pre-built signals. Paid plans add the full preset library, custom scans and real-time alerts. The page lists no prices.
The limits are focus and coverage. The tool leans toward technical analysis, and the AI pattern scanner covers only the top 500 coins. It also re-scans every few hours, not continuously.
How to move from a market overview to detailed research
You do not need every tool open at once. Work through a small number of questions, and use the next tool to resolve a specific uncertainty.
Open CoinStats Crypto Bubbles and compare the daily view with a longer period. Check which assets and filters are included before treating the display as a picture of the whole market.
Open the CoinStats Crypto Bubbles, set it to one week and filter one category. Note the two coins that look different from the rest of their sector. Then run those coins through other deep research crypto screeners. The goal is to find anomalies and arrive at a clear explanation for performance.
Frequently asked questions
What is the best crypto screener for beginners?
A visual tool is the easiest place to start. CoinStats Crypto Bubbles is free, needs no account and shows the top 100 coins by default, with size and color that are easy to read.
Are crypto screeners free?
Many crypto screeners are free. CoinStats Crypto Bubbles needs no account. Deeper research tools often limit features on free plans.
What is the difference between a crypto screener and a crypto heatmap?
A heatmap shows the whole market visually, using tile size and color for metrics like market cap and price change. A screener usually filters coins in a table by rules you set, such as volume or RSI. Heatmaps help you spot what is moving. Screeners help you narrow down what to research.
Can a crypto screener tell me which coin to buy?
No. A screener builds a shortlist from rules you choose. It cannot judge risk, timing or whether a project is honest. A coin can pass every filter and still fall. Use screener results as a starting point for research, and check liquidity, fundamentals and your own risk limits before you act.
How often does Crypto Bubbles update?
Crypto Bubbles refreshes prices and percentage changes about once a minute while the page is open, and a timestamp shows the last successful fetch. Timeframes run from one hour to one year, so you can use it for a quick daily check or a longer view of sector moves.