Ethereum May be Heading for a Deeper Low. Here’s Why

0
0

Ethereum saw significant increases a few days ago, breaking out of its range-bound movement. The sharp burst ended a two-week trend.
However, the 1-day chart shows that since volatility increased on Feb 25, the asset has not seen massive surges above its previous highs. For example, it gained 11% last Tuesday, peaking at $2,148. While it broke above its fourteen-day high at the time, it remained within the channel it maintained for most of February.
Subsequent trading actions saw it retrace lower, continuing its rangebound movement between $2,150 and $1,800. Nonetheless, during its latest new month boost, ETH regained $2,200. It soon lost momentum, resulting in a decline that’s about to enter its 4th day.
In hindsight, Ethereum saw significant increases a few days ago as buying increased in spot and ETF. Data from SoSoValue shows that the apex altcoin saw its largest net inflow on Feb 4, coinciding with the 7% surge.
However, data from CryptoQuant explains why prices retraced afterward. In response to the sudden, investors moved to take profit. Exchange inflows exceeded 1.2 million ETH, the highest in more than seven days.
The buyers failed to absorb the growing supply, resulting in rising exchange reserves. Prices retraced in response. Nonetheless, the selling extended to exchange-traded funds, with the instrument posting negative net flows over the last two weekdays.
Following the massive surge and subsequent decline, there is speculation that max pain will follow in the coming days.
Will Ethereum Retrace Lower?
A closer look at the 1-day chart reveals that the latest decline followed the asset breakout from the bollinger bands. It also shows that the breakout happened twice in the fourteen days. The first took place on Feb 25, resulting in a retest of the lower band a few days later.
Considering previous price movements, a repeat is likely in the coming days. Ethereum is trading near the middle band after a three-day decline. If the downtrend persists, a drop to the lower band is inevitable.
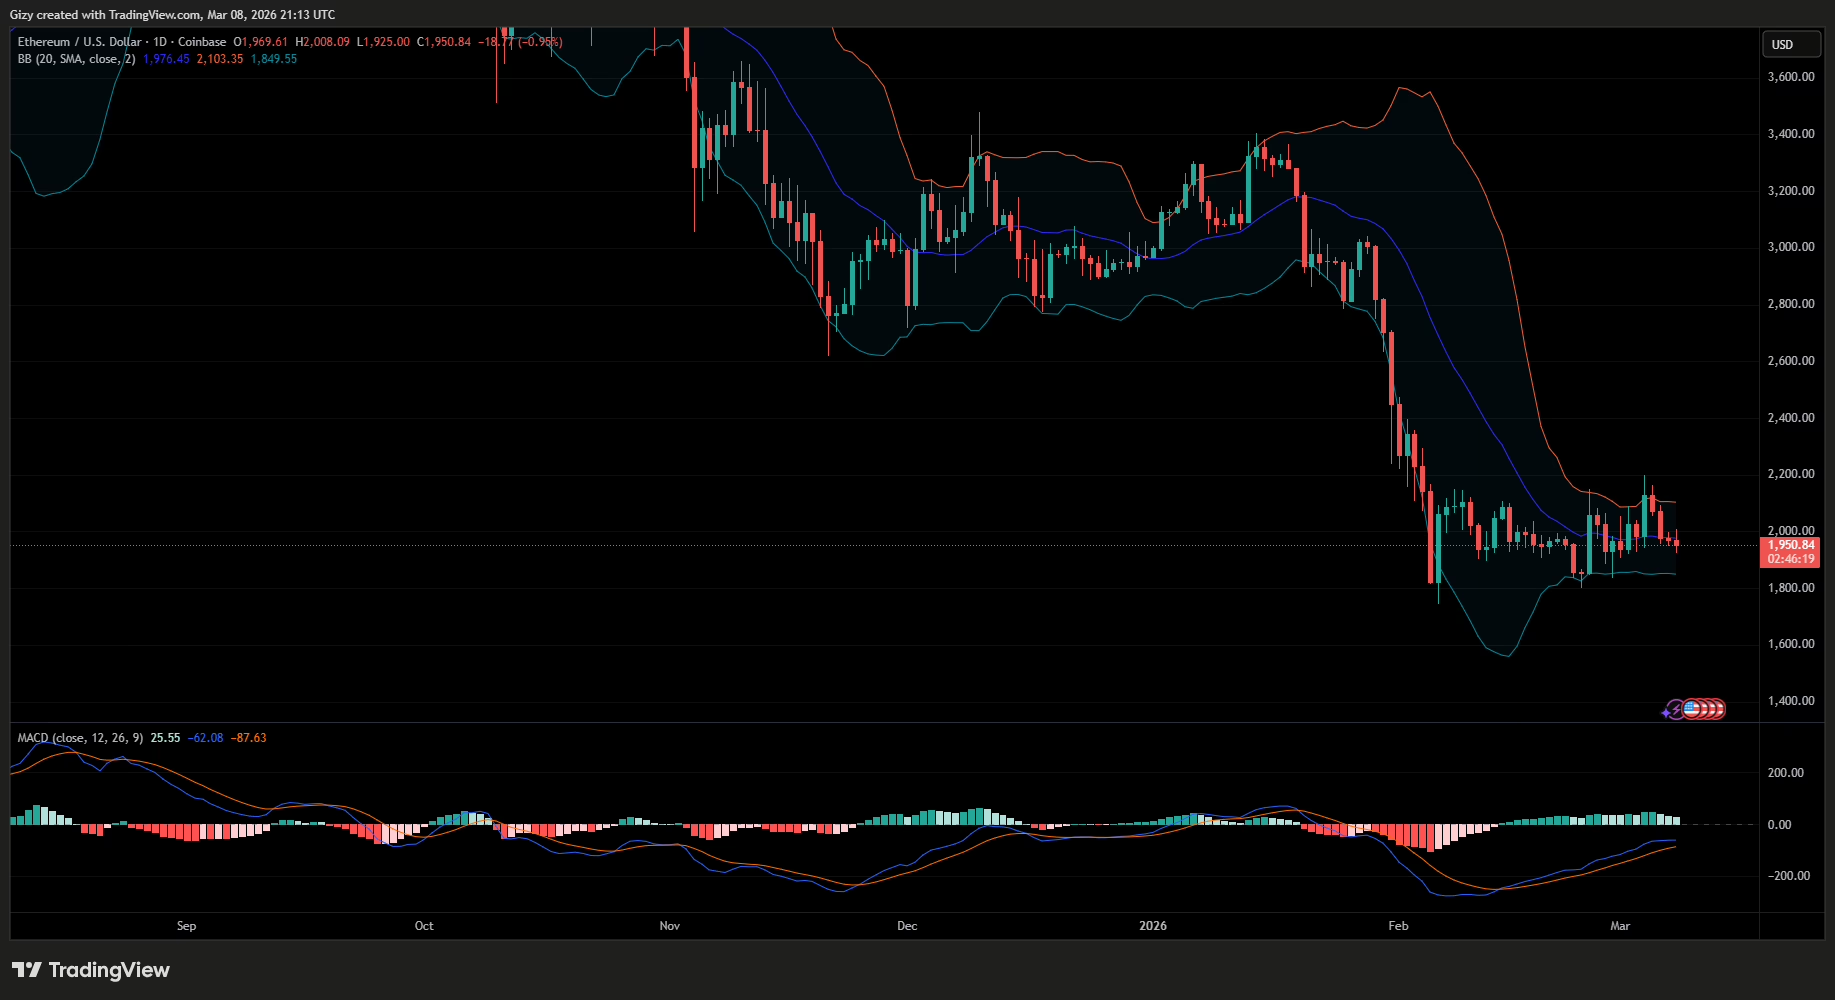
The altcoin will retest $1,850 if selling pressure intensifies. However, price action since the start of March reveals a new critical level. ETH has held $1,910 support since the start of the month, with no slips. If the bulls fail to defend this barrier, the asset will retest $1,800.
While previous price movements and the BB place the bottom around $1.8k, the moving average convergence divergence points to a lower bottom. Its 12-EMA has halted its rise following the consistent decline over the last three days. As the gap between the 12- and 26-EMAs narrows, a negative crossover is likely in the coming days.
A bearish divergence in MACD will signal steeper selloffs, suggesting more intense selling pressure than in the past three days.
Recall that Ethereum created a fair value gap at $1,742 during the first week of February. It has since gradually retraced to $1,800, but is yet to fill the gap. The filling may happen within the next two weeks if the selling pressure continues.
In a nutshell, the moving average convergence divergence suggests a high chance of registering a deeper low in the coming days.
The post Ethereum May be Heading for a Deeper Low. Here’s Why appeared first on CoinTab News.
0
0

 Manage all your crypto, NFT and DeFi from one place
Securely connect the portfolio you’re using to start.

0
0


0
0
