
Chainlink Price Prediction: LINK Keeps Returning To The Same Spot

0
0

CHAINLINK PRICE PREDICTION is getting attention again, and this time it is not because of a headline. It is the chart doing the talking.
LINK has been repeating the same move over and over on the shorter timeframe, and every single time, buyers have shown up at the exact same spot.
That kind of repetition rarely happens by accident, and traders watching this pattern are now waiting to see if it plays out one more time or if this is finally the visit where it fails.
Chainlink Price Right Now
Metric | Value |
Price | $8.577 |
24h Change | -0.41% (-$0.03531) |
Market Cap | $6.42B |
Futures Volume (24h) | $234.43M |
Spot Volume (24h) | $39.80M |
Open Interest | $448.90M |
Circulating Supply | 748.09M LINK |
Total Supply | 1.00B LINK |
Max Supply | 1.00B LINK |
Source: CoinGlass LINK data, as of July 23, 2026. Figures may vary slightly across other tracking websites.
Methodology And Data Sources
This Chainlink price prediction pulls live price, volume, and open interest figures from CoinGlass, liquidation flow from CoinGlass's dedicated liquidation tracker, and ETF flow data from SoSoValue's official LINK spot ETF tracker.
Chart structure is read directly off the 4-hour LINK/USDT chart on Binance via TradingView. Every level mentioned below is treated as invalidated only on a confirmed candle close beyond that level, not on a brief intraday wick through it.
Chainlink Liquidation Data Today
Liquidation flow over the past day shows longs taking the bulk of the pressure on the shorter timeframes, with shorts only starting to feel it as the window widens.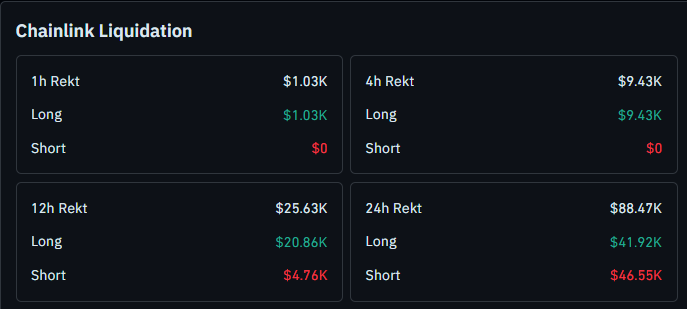
Over the past hour, $1.03K was liquidated, and all of it came from longs, with nothing lost on the short side.
The 4-hour window tells the same story, with $9.43K wiped out, again entirely from longs.
Stretch that to 12 hours and total liquidations reach $25.63K, made up of $20.86K in longs and $4.76K in shorts.
Across the full 24 hours, liquidations climb to $88.47K, with $41.92K coming from longs and $46.55K from shorts.
The shift toward heavier short liquidations as the window widens lines up with sellers getting caught out each time $LINK found buyers instead of breaking down. Full data is available through the Chainlink liquidation tracker.
Chainlink ETF Flows: What The Data Shows
According to SoSoValue's LINK spot ETF tracker, $LINK spot ETF products logged a daily net inflow of $2.68M on July 22, 2026, pushing cumulative net inflows to $127.83M with $2.99M in total value traded that day and total net assets at $114.78M.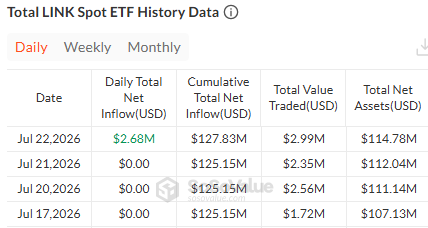
That follows three flat days before it.
July 21 and July 20 both showed zero daily net inflow, holding cumulative inflows at $125.15M, while July 17 also came in flat with cumulative inflows at the same $125.15M mark, though total net assets on that day sat lower at $107.13M.
The pattern points to steady, if uneven, institutional interest rather than a consistent daily buying trend, and it is worth treating as background context rather than a standalone signal for where price goes next.
Chainlink Price Prediction: 4-Hour Chart Analysis
Methodology note: This reading uses the 4-hour LINK/USDT chart on Binance via TradingView, combining price structure with trendline behavior. Levels are only considered invalidated on a confirmed candle close beyond the stated trigger, not an intraday wick.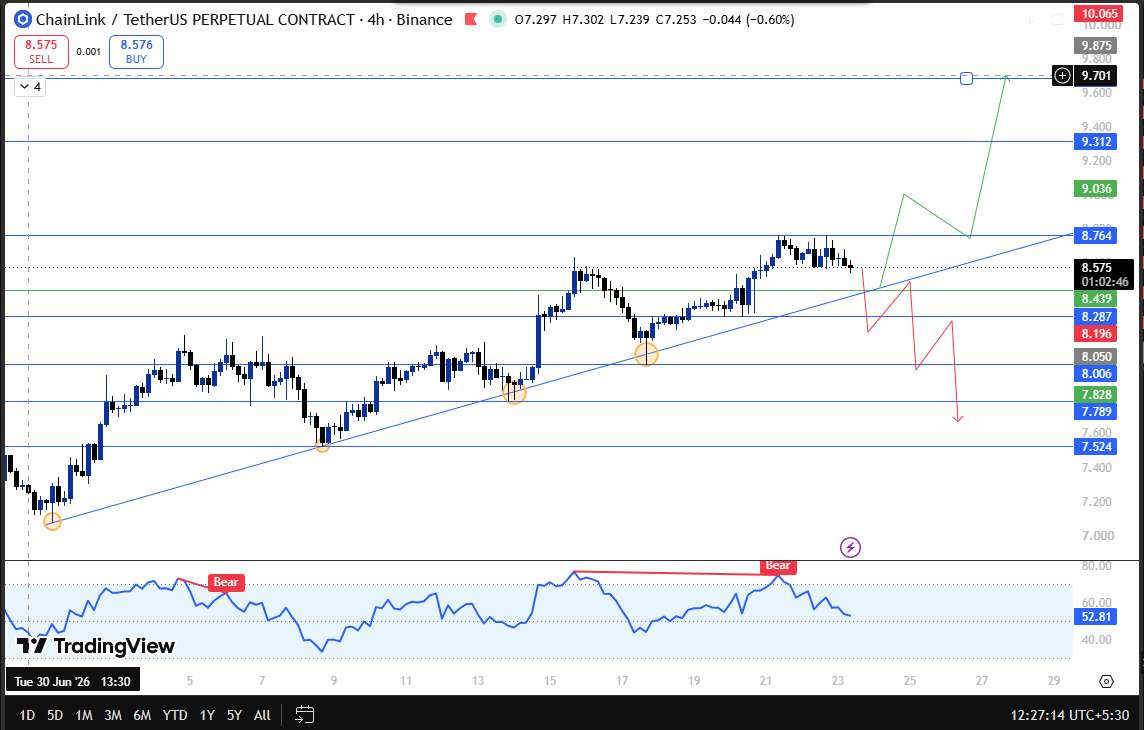
On the 4-hour chart, LINK has been climbing along a rising trendline for several sessions now, and the way price keeps interacting with that line is what makes this setup worth watching.
Price tapped this trendline for a second time, then a third, and then a fourth, and on every single one of those touches, LINK pushed higher right after.
That is now four separate reactions off the same rising line, which is a stronger signal than a single bounce would ever be.
Right now, $LINK is trading a touch above that trendline again, sitting near $8.577.
If price comes back down and taps the trendline one more time, the pattern so far suggests buyers are likely to step in and push price higher again, with the next resistance levels sitting at $8.764, followed by $9.312, and then $9.686 further out.
On the other hand, if LINK breaks down through $8.287 and closes below it, that would be the first real sign that this trendline has stopped working.
From there, support levels to watch become $8.006 and $7.789, with $7.524 as the deeper level further down.
Chainlink Technical Snapshot
Indicator | Signal |
Trend | Bullish, trading above rising 4H trendline |
Structure | Fourth consecutive bounce off the same trendline |
Liquidations | Shorts absorbing more damage as window widens |
ETF Flows | Latest day positive, prior three days flat |
Chainlink Support And Resistance Levels To Watch
Type | Level | Note |
Resistance 3 | $9.686 | Extended upside target |
Resistance 2 | $9.312 | Secondary resistance |
Resistance 1 | $8.764 | First target if trendline holds |
Current Price | $8.575 | Trading above the rising trendline |
Breakdown Trigger | $8.287 | A confirmed close below invalidates the trendline |
Support 2 | $8.006 | First support on breakdown |
Support 3 | $7.789 | Deeper support level |
Last Support | $7.524 | Final downside level in view |
Risk-Reward Table
Case | Trigger | Target |
Bull Case | The trendline holds on next retest | Move toward $8.764, then $9.312 and $9.686 |
Bear Case | Breaks and closes below $8.287 | Slide toward $8.006, then $7.789 and $7.524 |
Invalidation Level
This bullish read on $LINK depends on the rising trendline continuing to hold on each retest. A confirmed 4-hour close below $8.287 would break that structure entirely and shift the picture toward the downside levels listed above.
Historical Context
What stands out about this move is the consistency of it. $LINK has now bounced off the same rising trendline four separate times, and each bounce has produced a fresh push higher rather than a weak, fading reaction.
Patterns like this do not hold forever, but a trendline that has been defended this many times in a row tends to draw in more buyers each time price comes back to test it, simply because the reaction has already proven itself repeatedly.
Chainlink Glossary
Ascending Trendline: A rising line connecting a series of higher lows, often used to track where buyers keep stepping in as price trends upward.
Liquidation: What happens when a leveraged trade gets forcibly closed because the trader ran out of margin to keep it open.
Open Interest: The total value of derivative positions like futures that remain open and have not been settled.
Spot ETF Net Inflow: The amount of new money entering an ETF product on a given day, used as a rough gauge of institutional demand.
Expert View
LINK bouncing off the same rising trendline four times in a row is the kind of repeated confirmation that tends to matter more than a single reaction would on its own.
Each retest has been met with fresh buying rather than a breakdown, and that pattern, combined with a positive ETF inflow day after a flat stretch, leans in favor of continuation as long as the trendline keeps holding.
A confirmed close below $8.287 would be the clearest signal that this trendline has finally lost its grip, opening the door toward $8.006 and eventually $7.789.
Disclaimer: This article is for informational purposes only and should not be considered financial advice. Cryptocurrency markets are highly volatile, and price predictions are not guaranteed. Please do your own research before making any investment decisions.
0
0

 Manage all your crypto, NFT and DeFi from one place
Securely connect the portfolio you’re using to start.

0
0

0
0

0
0

0
0