
DeXe Price Prediction: Why DEXE Price Is Surging Today

0
0

Something is stirring around $DEXE again, and traders who track this coin already know when $DEXE moves, it rarely moves quietly.
What Is Driving The Sudden Buzz Around DeXe Right Now
DeXe price prediction chatter has picked up fast today. Basically, the coin jumped hard while most of the market was still figuring out its next move. Turns out, this wasn't a random spike either.
$DEXE is currently trading near $27.6, up more than 14% in a single day. That kind of move gets attention. But the bigger question isn't the number itself.
It's what happens after a jump like this. Does it hold? Or does it fade the way so many quick rallies do?
We pulled up the chart expecting a slow grind higher. What we found instead was a coin pressing right against its own upper trendline, with RSI already stretched into overbought territory. So where does $DEXE actually go from here?
DeXe Coin Snapshot: Price, Supply, And Market Position Today
| Metric | Value |
|---|---|
| Coin Name | DeXe |
| Ticker Symbol | DEXE |
| Blockchain | Ethereum (ERC-20) |
| Today High | $27.906 |
| Today Low | $25.539 |
| RSI Level | 79.64 |
| Token Type | Governance and utility token |
| Token Category | Yield farming and DeFi |
| Market Cap | $2.31 billion |
| 24H Trading Volume | $39.6 million |
| 24H Trading Volume Change | +35.44% |
| Circulating Supply | 83.73 million DEXE |
| 24H Change | +14.64% |
Source: Data by CoinMarketCap
Understanding What DeXe Actually Does As A Project
DeXe runs on Ethereum and works as a decentralized platform for building and managing DAOs. Basically, it gives communities the tools to vote, govern, and manage treasuries without needing a middleman.
The project has been around long enough to build a real holder base, with over 51,000 wallets currently holding $DEXE according to onchain trackers. Some of that community growth traces back to how actively the team has run crypto airdrops and incentive campaigns in the past.
Price History And How $DEXE Got Here
$DEXE's all-time high sits at $33.54, set back in March 2021. That's still about 17% above where the coin trades today, so the token hasn't fully reclaimed its old glory yet.
Here's the thing: the all-time low was just $0.4391, hit in October 2025. From that point, $DEXE is up over 6,186%. That's not a typo, and it tells you how violent this coin's swings can get.
Why This DeXe Rally Is Not Just Random Hype
DEXE isn't a brand new presale token riding pure speculation. It carries a CertiK audit rating of 4.3, which adds a layer of credibility most low-cap tokens simply don't have.
The token also sits inside the broader Ethereum ecosystem, which means its fate is loosely tied to how Ethereum itself performs through this cycle.
DeXe Liquidation Data Shows Who Got Caught Offside
Short sellers took the brunt of this move. In the last 24 hours, $223.83K in positions got liquidated, and $220.56K of that came from shorts alone.
Even in the last hour, shorts accounted for the entire $5.58K wiped out. Basically, anyone betting against $DEXE today got punished fast.
Source: Liquidation data by CoinGlass
What The Fundamentals Say About DeXe Right Now
Fully diluted valuation stands at $2.66 billion against a live market cap of $2.31 billion, meaning most of the supply is already circulating. That's usually a healthier setup than a token with heavy unlocks still ahead.
The volume-to-market-cap ratio is at 1.7%, showing decent trading interest relative to size.
DeXe Technical Analysis: Breaking Down The DeXe Chart: RSI, EMA, And Channel Structure
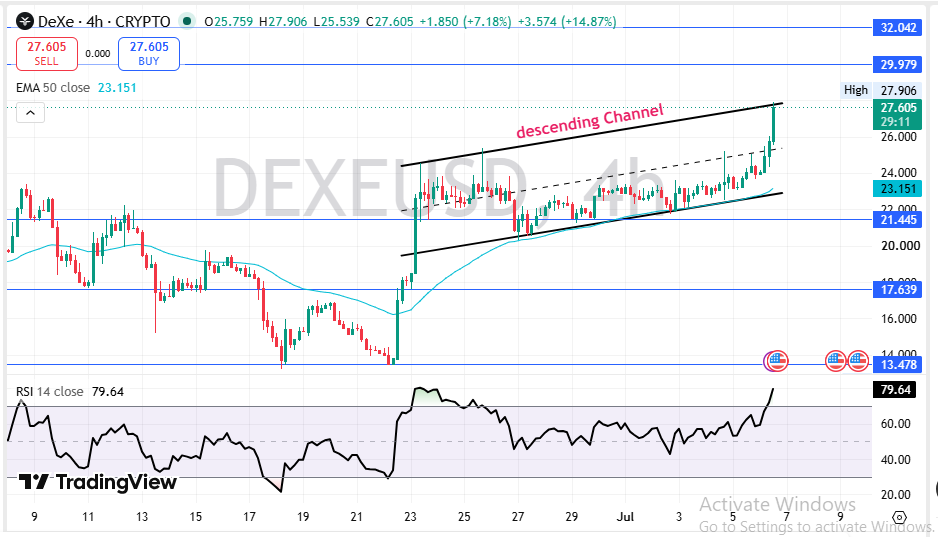
Price is riding inside an ascending channel on the 4-hour chart and is now pressing right against the upper band. That's the first thing that stood out.
Source: Charting by TradingView
RSI at 79.64 is deep in overbought land. It doesn't mean a drop is guaranteed, but broader sentiment gauges like the Fear and Greed Index are worth checking before chasing a move this stretched.
The 50 EMA sits way below at $23.151, confirming the broader trend is still up despite how sharp this move has been.
Immediate support sits at $21.445.
On the upside, resistance is stacked at $29.979 and then $32.042.
DeXe Volume Heatmap Reveals Where The Action Is
Binance is doing the heavy lifting here, handling $35.36M of $DEXE volume. LBank follows at $10.21M, with Bybit at $6.49M.
Smaller platforms are also seeing steady flow, and that spread across multiple exchanges suggests this isn't a single venue pump.
Source: Volume heatmap by CoinGlass
DeXe Short-Term Price Outlook: What The Next Few Weeks Could Bring
The next one to four weeks likely decide whether this breakout holds or fails right where it started.
| Timeframe | Bearish Target | Base Target | Bullish Target | Key Trigger |
|---|---|---|---|---|
| 24 Hours | $25.50 | $27.60 | $29.98 | Reaction at upper channel band |
| 3–7 Days | $23.15 | $27.00 | $32.04 | RSI cooling off or fresh volume push |
| 2–4 Weeks | $21.45 | $25.00 | $34.00 | Weekly close above resistance |
Watch how price behaves right at $29.98. That level says a lot.
DeXe Long-Term Price Forecast Through The Coming Years
Zooming out, $DEXE's long-term path depends on whether DAO tooling demand keeps growing across Ethereum.
| Timeframe | Bearish Target | Base Target | Bullish Target | Catalyst Needed |
|---|---|---|---|---|
| 3 Months | $19.00 | $28.00 | $36.00 | Sustained volume above $30M daily |
| 6 Months | $15.00 | $30.00 | $42.00 | New DAO integrations or partnerships |
| End of Year | $12.00 | $32.00 | $50.00 | Broader altcoin season confirmation |
| Following Year Outlook | $10.00 | $28.00 | $55.00 | Ethereum ecosystem growth and adoption |
Honestly, the long-term case leans more on Ethereum's own momentum than on $DEXE alone, and that makes it a moderate case, not a slam dunk.
Three Realistic Price Scenarios For DeXe Traders
Worst Case: RSI exhaustion triggers a sharp pullback below $21.445, dragging price back toward the EMA zone.
Base Case: Price consolidates under resistance for a few days before attempting another push higher.
Best Case: A clean breakout above $29.979 with strong volume opens the door toward $32 and beyond.
| Scenario | Price Range | What Triggers It |
|---|---|---|
| Worst Case | $17.60–$21.45 | Channel breakdown, RSI reversal |
| Base Case | $21.45–$27.60 | Sideways grind, profit-taking |
| Best Case | $29.98–$34.00 | Volume-backed breakout |
Key DeXe Price Levels Every Trader Should Track
Resistance zones: $29.979 and $32.042, both needing strong volume to clear cleanly.
Support zone: $21.445, the first cushion if momentum fades.
Invalidation zone: Below $17.639, a close here would break the current bullish structure entirely. Anyone timing entries around this range might also want to keep an eye on the coin events calendar for upcoming catalysts.
DeXe Analyst View And Final Thoughts On Where This Goes
The chart setup right now favors buyers, but barely. RSI at 79.64 is a warning sign, not a green light.
A weekly close above $29.979 would confirm this breakout has real legs behind it. Anything less, and this starts looking like a fakeout.
One factor worth tracking beyond the chart is regulation. Shifts like the EU crypto licensing rules tend to ripple into how exchanges handle mid-cap tokens like $DEXE.
The most important level to watch remains $29.979. Everything hinges on that number.
$DEXE looks strong today. But strong and sustainable aren't always the same thing.
Disclaimer: This article is for educational purposes only and does not constitute financial advice. Crypto markets are volatile. Consult your investment advisor before making any investment decision.
0
0

 Manage all your crypto, NFT and DeFi from one place
Securely connect the portfolio you’re using to start.

0
0

0
0

0
0

0
0