
Chainlink Crypto Hits Overbought RSI of 74 as It Nears $9.93 Resistance

0
0

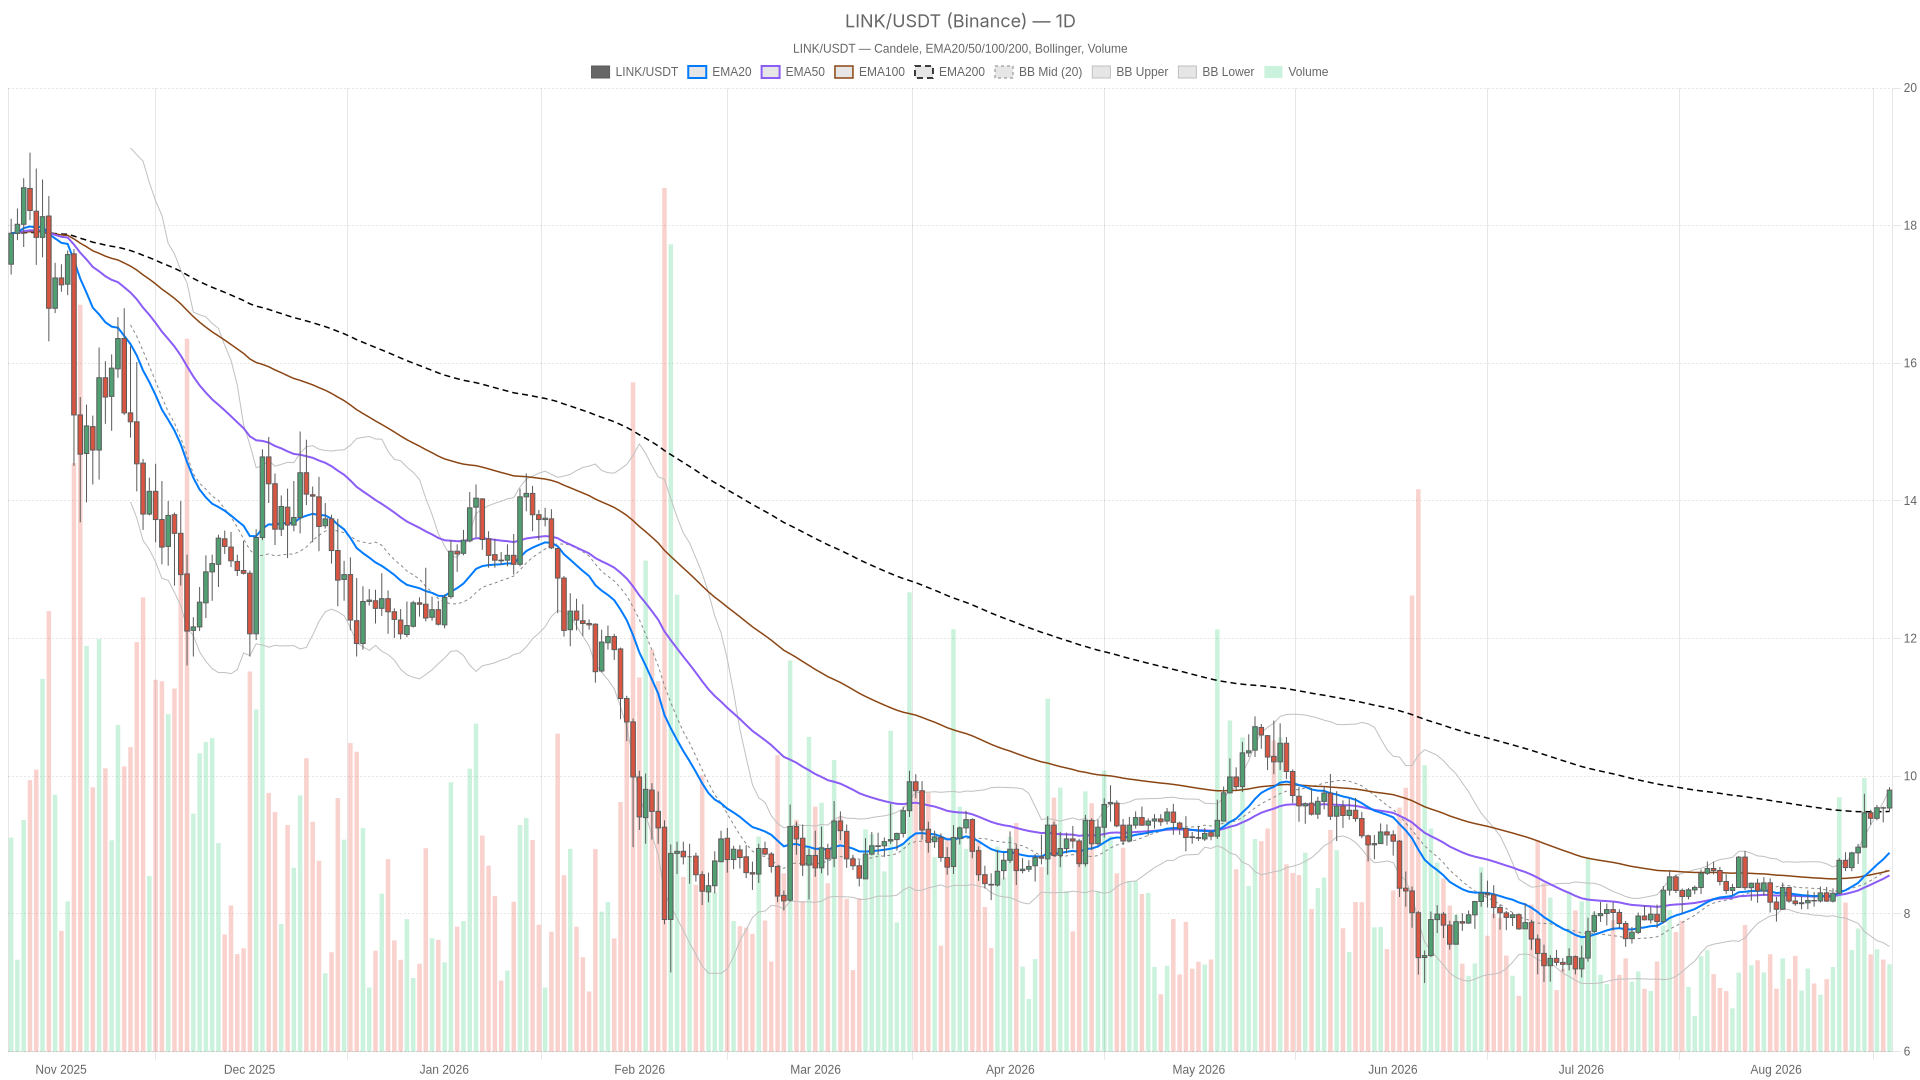
Trading at $9.80 on August 19, 2026, Chainlink crypto sits precisely on its daily upper Bollinger Band, a tense setup demanding a clear choice. Is this a genuine breakout, or is LINK overheating? The daily RSI at 74.29 screams overbought, yet momentum remains stubbornly positive.
Key takeaways
- LINK trades at $9.80, pinned against its daily upper Bollinger Band at $9.81
- Daily RSI14 at 74.29 places the asset firmly in overbought territory
- The Fear & Greed Index reads 46 (Fear), signaling cautious market sentiment
- Total crypto market cap stands at $2.29 trillion with Bitcoin dominance at 56.52%
- Lower timeframes remain bullish but show decelerating momentum across both the 1H and 15m charts
Daily Structure: Strength Meeting Its Own Limits
LINK’s daily chart reflects a recovery move rather than a clean bullish trend, with price extended against its upper Bollinger Band while the RSI signals overbought conditions. The bullish EMA stack is intact, but mean-reversion risk is elevated. On the daily chart, LINK closed at $9.80, above its EMA20 ($8.89), EMA50 ($8.56) and EMA200 ($9.49).
That is a bullish stack in principle, but the order is unusual — the 200-period average sits above the 50-period one, a fingerprint of a market that dropped hard and has since clawed its way back through its long-term average. That is not a clean trend; it is a recovery move, and recovery moves tend to run into supply zones faster than fresh trends do.
Meanwhile, the RSI14 at 74.29 confirms the asset is deep into overbought territory on the daily timeframe, while price presses against the upper Bollinger Band at $9.81 with the mid-band at $8.67. When price rides the upper band this tightly alongside an overbought RSI, it usually signals an extended move rather than an early-stage one.
However, the MACD tells a slightly different story: the line (0.35) remains above the signal (0.22), with a positive histogram of 0.13. This means the bullish impulse has not rolled over yet. The daily regime is technically neutral, which fits — momentum and mean-reversion signals are actively fighting each other here.
1H and 15m: Bullish Alignment, But the Engine Is Cooling
The lower timeframes confirm the uptrend’s direction but reveal visibly decelerating momentum, with the 15-minute chart showing a flat MACD histogram and a cooling RSI at 59.01. On the 1-hour chart, the picture is cleaner: EMA20 (9.64), EMA50 (9.55) and EMA200 (9.19) are stacked in proper bullish order, and the regime reads bullish.
RSI14 at 65.61 is elevated but not extreme, and the MACD remains positive (0.08 versus 0.06 signal). That said, the histogram has thinned to just 0.02 — momentum is present but decelerating. The 15-minute chart echoes the same message with less enthusiasm. Price ($9.79) is squeezed against a tight Bollinger range (9.71–9.82), EMAs remain bullish, but the MACD histogram is flat at zero.
In practical terms, the smaller timeframes confirm the daily uptrend’s direction but are flagging a pause. This is where execution matters more than conviction. A breakout attempt here needs volume and follow-through, not just proximity to resistance.
Key Levels, Volatility and Where LINK Could Go Next
LINK is wedged between the daily pivot at $9.71 and resistance at $9.93, with moderate volatility suggesting incremental rather than explosive moves unless a volume spike materializes. The pivot structure on the daily frame puts support (S1) at $9.58, and price currently sits between the pivot and R1. That leaves a defined pocket of room before sellers historically start appearing.
Meanwhile, daily ATR14 sits at 0.31, roughly 3% of current price — a meaningful but not explosive volatility band, useful for sizing stops rather than expecting violent swings. On the hourly chart, the pivot (9.77) and R1 (9.82) are compressed just above spot price, with the tighter ATR14 of 0.10 reinforcing that near-term moves are likely to be incremental rather than dramatic.
Bullish Scenario
If LINK can close decisively above the daily upper Bollinger Band ($9.81) and clear the R1 pivot at $9.93, the bullish stack across the 1H and 15m timeframes gives that move credibility rather than treating it as a blow-off top. Moreover, continued positive MACD histograms on the daily and hourly charts would support a push toward fresh highs. This scenario would be invalidated if price stalls below $9.93 and rolls back under the hourly EMA20 (9.64) — that would suggest the breakout attempt failed at resistance rather than through it.
Bearish / Mean-Reversion Scenario
Conversely, the overbought RSI combined with price hugging the upper Bollinger Band is the classic setup for a pullback toward the daily mid-band ($8.67) or, more conservatively, back to the EMA20 ($8.89) or the S1 pivot ($9.58). A rejection below the daily pivot ($9.71) would tilt this scenario into motion, and a break of the hourly Bollinger lower band ($9.37) would confirm sellers are back in control. This case would be invalidated if RSI stays elevated while price keeps printing higher highs and the MACD histogram expands again rather than contracts.
Positioning and Risk
Broader market conditions — with the Fear & Greed Index at 46 and Bitcoin dominance at 56.52% — suggest capital is not rotating aggressively into altcoins, making LINK’s overbought reading a signal for caution rather than conviction. According to CoinGecko data, total crypto market capitalization stands at roughly $2.29 trillion, up 0.72% over 24 hours.
That combination — modest overall market growth, cautious sentiment, but a still-dominant BTC — suggests capital is not rotating aggressively into altcoins like Chainlink crypto just yet. This makes LINK’s overbought daily reading worth watching closely rather than chasing blindly.
The technical picture here is not contradictory so much as layered: the daily chart is stretched and due for either a breakout confirmation or a cooling-off period, while the shorter timeframes are bullish but visibly losing thrust. Volatility, as measured by ATR, remains moderate rather than extreme, which means big directional resolution may take time rather than happening in a single candle. Consequently, traders watching LINK right now should treat the current zone as a decision point, not a foregone conclusion, and size any position with the daily ATR and key pivot levels in mind.
FAQ
Is LINK overbought right now?
Yes. The daily RSI14 reads 74.29, which places LINK firmly in overbought territory. When combined with price hugging the upper Bollinger Band, this typically signals an extended move that is vulnerable to mean reversion rather than the early stage of a fresh trend.
What are the key support and resistance levels for LINK?
The daily pivot sits at $9.71, with resistance (R1) at $9.93 and support (S1) at $9.58. On the hourly chart, the pivot is at $9.77 and R1 at $9.82. A close above $9.93 would open the door to fresh highs, while a break below $9.58 would signal sellers gaining control.
Can LINK break out despite the overbought RSI?
It is possible if LINK closes decisively above the daily upper Bollinger Band ($9.81) and clears R1 at $9.93, supported by continued positive MACD histograms on both the daily and hourly charts. However, the overbought RSI and cautious broader market sentiment — with the Fear & Greed Index at 46 — make a pullback the more probable short-term outcome.
Disclaimer: This article is for informational purposes only and does not constitute financial advice, an investment recommendation, or a solicitation to buy or sell any financial instrument or cryptocurrency. The analysis provided is not indicative of future results. Investing in crypto assets and financial markets carries a high risk of capital loss. Always do your own research (DYOR) and consult a qualified financial advisor before making any decision.
Article produced with the assistance of artificial intelligence and reviewed by the editorial team.
0
0


 Manage all your crypto, NFT and DeFi from one place
Securely connect the portfolio you’re using to start.

0
0

0
0


0
0