Despite USDT’s $184 Billion Lead, USDC Is Winning Key National Markets

0
0

Circle’s USDC stablecoin has surged toward the $80 billion mark in circulating supply, while overtaking Tether’s USDT in adjusted transaction volume for the first time since 2019.
New country-level ownership data also shows USDC leading in several individual markets, suggesting the stablecoin race is splintering into a region-by-region contest rather than a single global battle.
USDC vs USDT War Splinters Into Regional Stablecoin Battles
Tether’s USDT has long dominated the stablecoin sector. With a market capitalization of roughly $184 billion, it remains more than twice that of its nearest rival.
Together, the two stablecoins account for approximately 93% of total stablecoin market capitalization, according to TRM Labs.
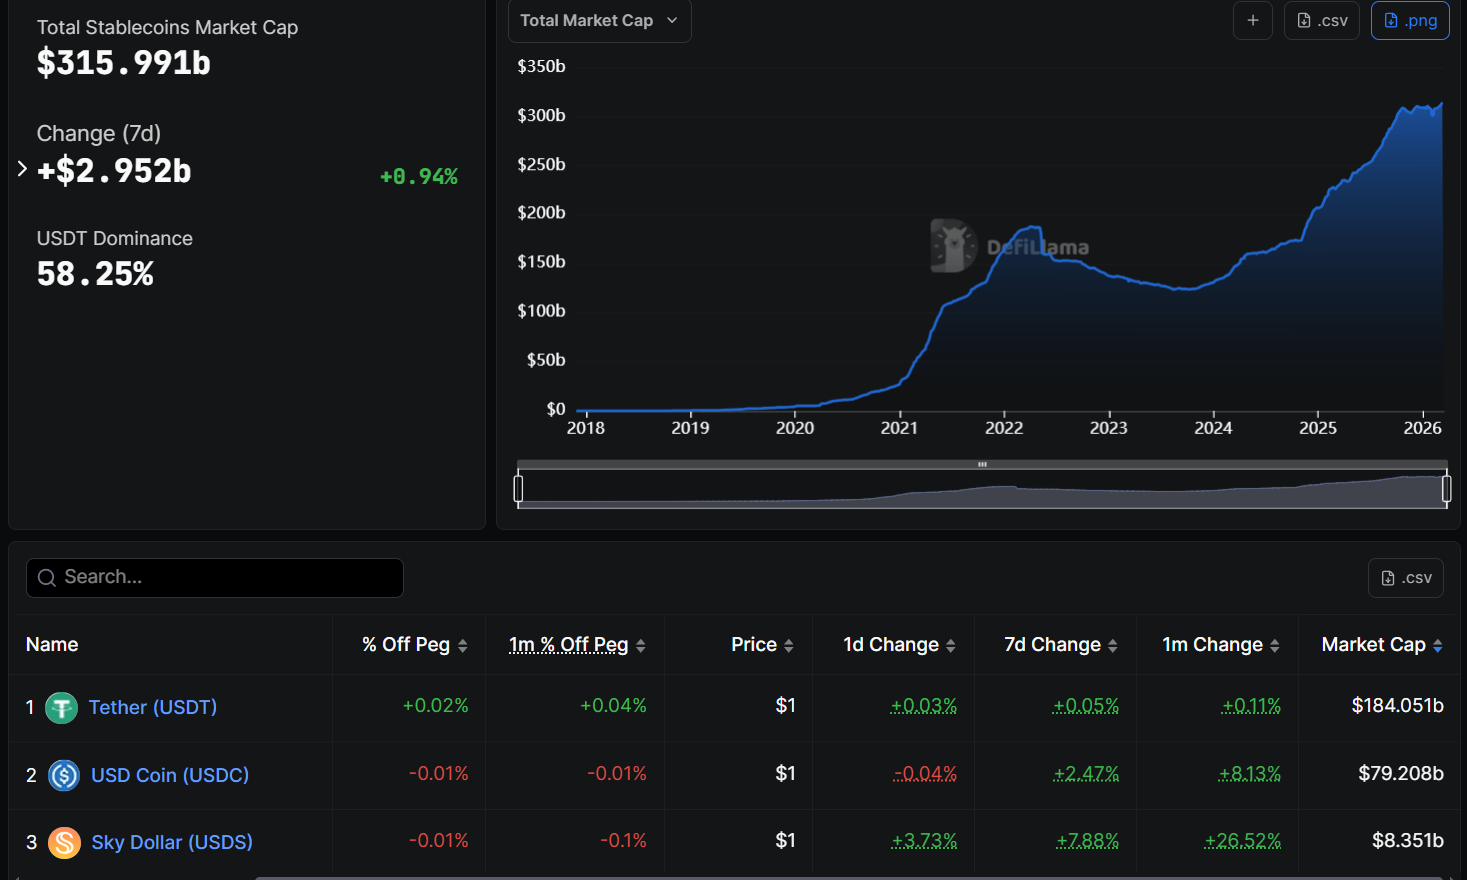 Tether (USDT) and Circle (USDC) Positions Among Stablecoins. Source: DefiLlama
However, the competitive picture has shifted significantly in early 2026. According to data from CoinMarketCap, USDC’s circulating supply climbed from just over $70 billion in early February to $75 billion at the start of March, before breaking past $79 billion.
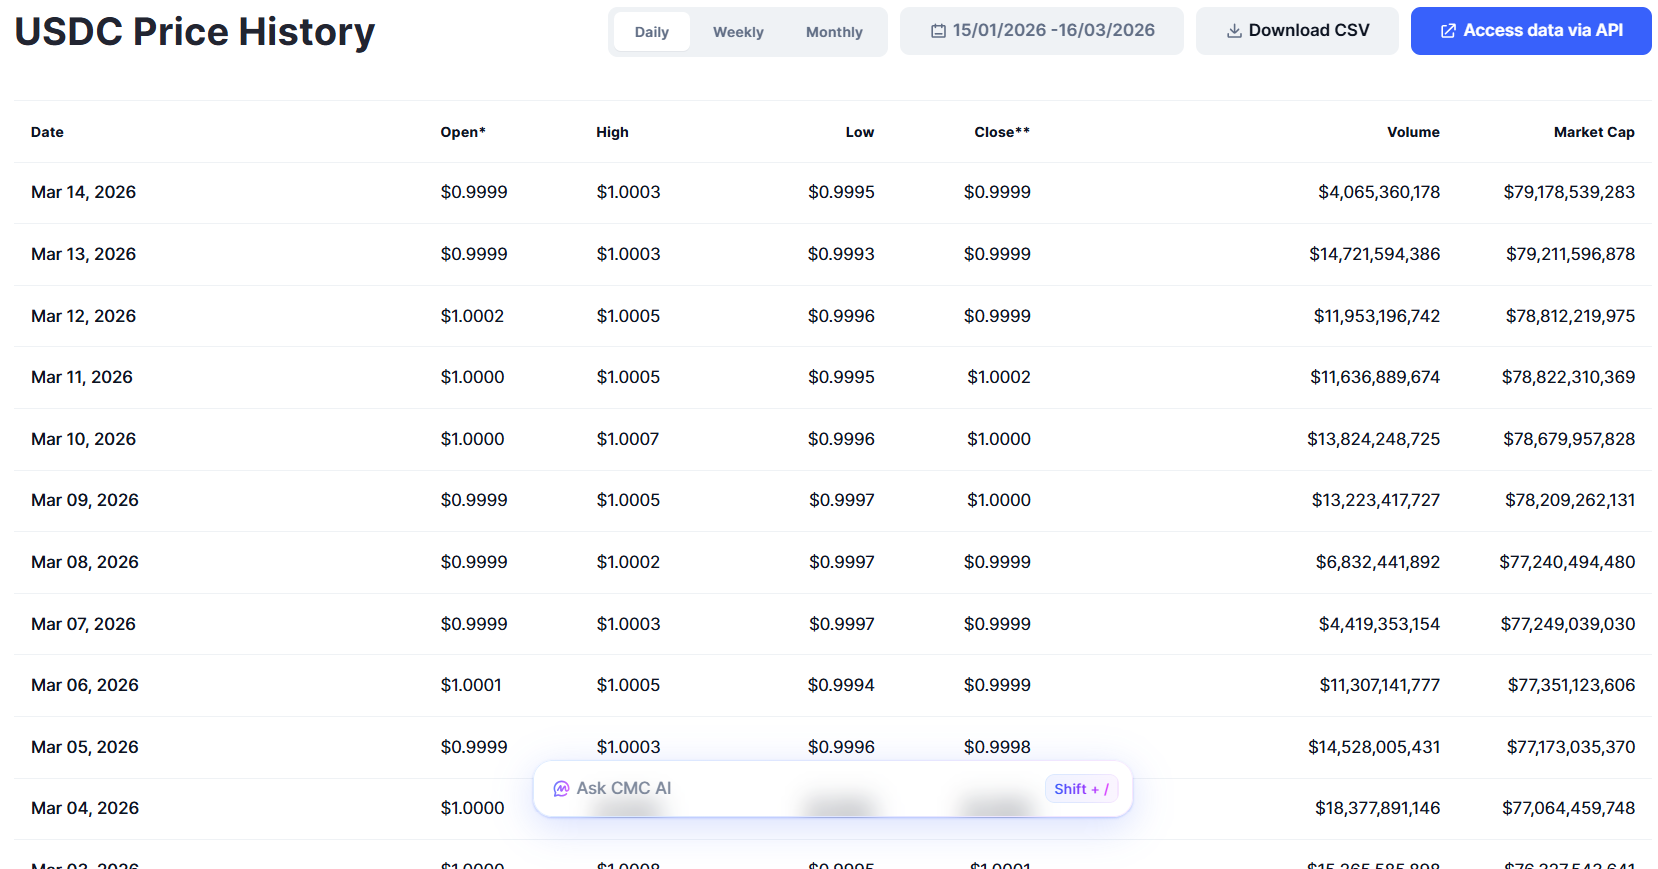 USDC Price Performance. Source: CoinMarketCap
That pace of expansion is among the fastest supply increases for any major stablecoin.
Meanwhile, research from Mizuho Financial Group published on March 13 found that USDC has processed approximately $2.2 trillion in adjusted transaction volume year-to-date, compared with $1.3 trillion for USDT.
That gives USDC roughly 64% of the combined adjusted volume between the two stablecoins, a sharp reversal from the 2019-2025 period when USDT consistently led, and USDC averaged only about 30%.
Mizuho defines adjusted volume as transfers involving centralized exchanges, decentralized exchanges, and other identified entities that represent genuine value transfers rather than automated or repetitive activity.
Country-Level Data Reveals a Fragmented Race
A separate dataset from BVNK’s Stablecoin Utility Report 2026, compiled with YouGov across 4,658 respondents in 15 countries, adds another layer.
Lisk Head of Research Leon Waidmann highlighted USDT versus USDC ownership rates across those markets.
Nigeria led all countries with 59% USDT ownership, compared with 48% for USDC, reflecting the stablecoin’s deep roots in economies with volatile local currencies.
USDT also led in India, the Philippines, Singapore, Thailand, Argentina, France, and the United Kingdom.
Yet in five markets, USDC ownership actually exceeded USDT. Colombia showed 29% USDC ownership versus 25% for USDT. South Africa registered 29% versus 23%.
Germany came in at 17% versus 15%, Brazil at 16% versus 14%, and the United States at 26% versus 22%.
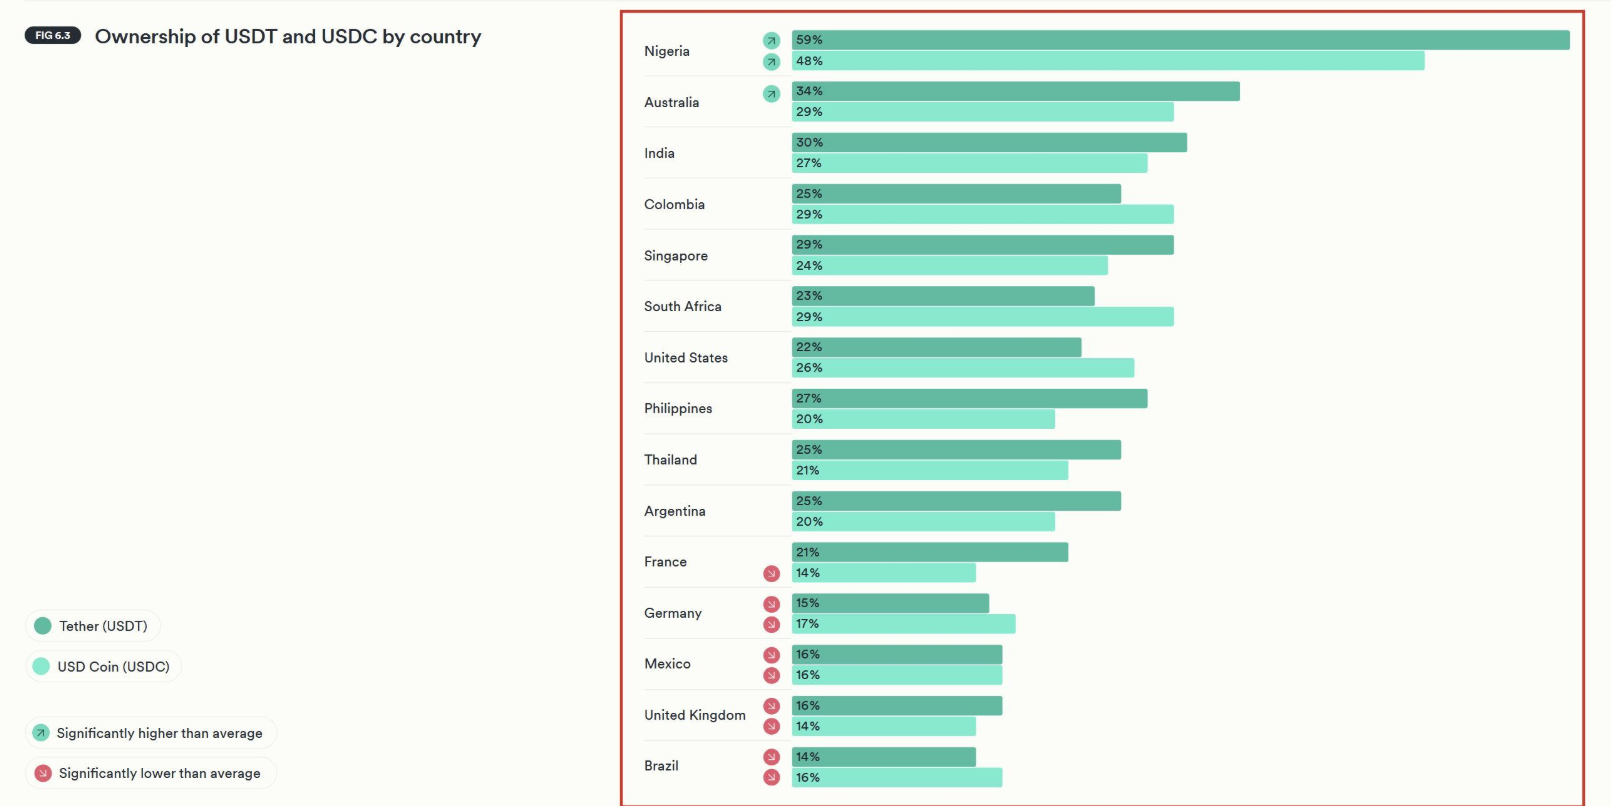 USDC vs USDC Ownership By Country. Source: Leon on X
“USDT vs USDC ownership by country. Ranked… USDC is catching up. In Colombia, South Africa, the US, Germany, and Brazil, USDC ownership actually exceeds USDT. The regulated stablecoin is gaining ground,” wrote Waidmann.
The pattern suggests that regulatory positioning may be influencing adoption. USDC, issued by Circle Internet Group, holds compliance licenses under both Europe’s Markets in Crypto-Assets (MiCA) regulation and aligns with the US GENIUS Act framework.
Tether has taken a different approach, opting out of MiCA compliance and concentrating growth in Asia and other non-Western markets.
Capital Flight and Transaction Trends Add Pressure
The supply surge also carries a geopolitical dimension. Dubai-based analyst Rami Al-Hashimi attributed part of the recent demand to capital flight from the UAE.
He noted that over-the-counter desks in Dubai have struggled to keep up with USDC orders amid sharp declines in Dubai’s real estate market.
The DFM Real Estate Index fell roughly 31% from a recent peak of around 16,800 to about 11,516, according to TradingView data.
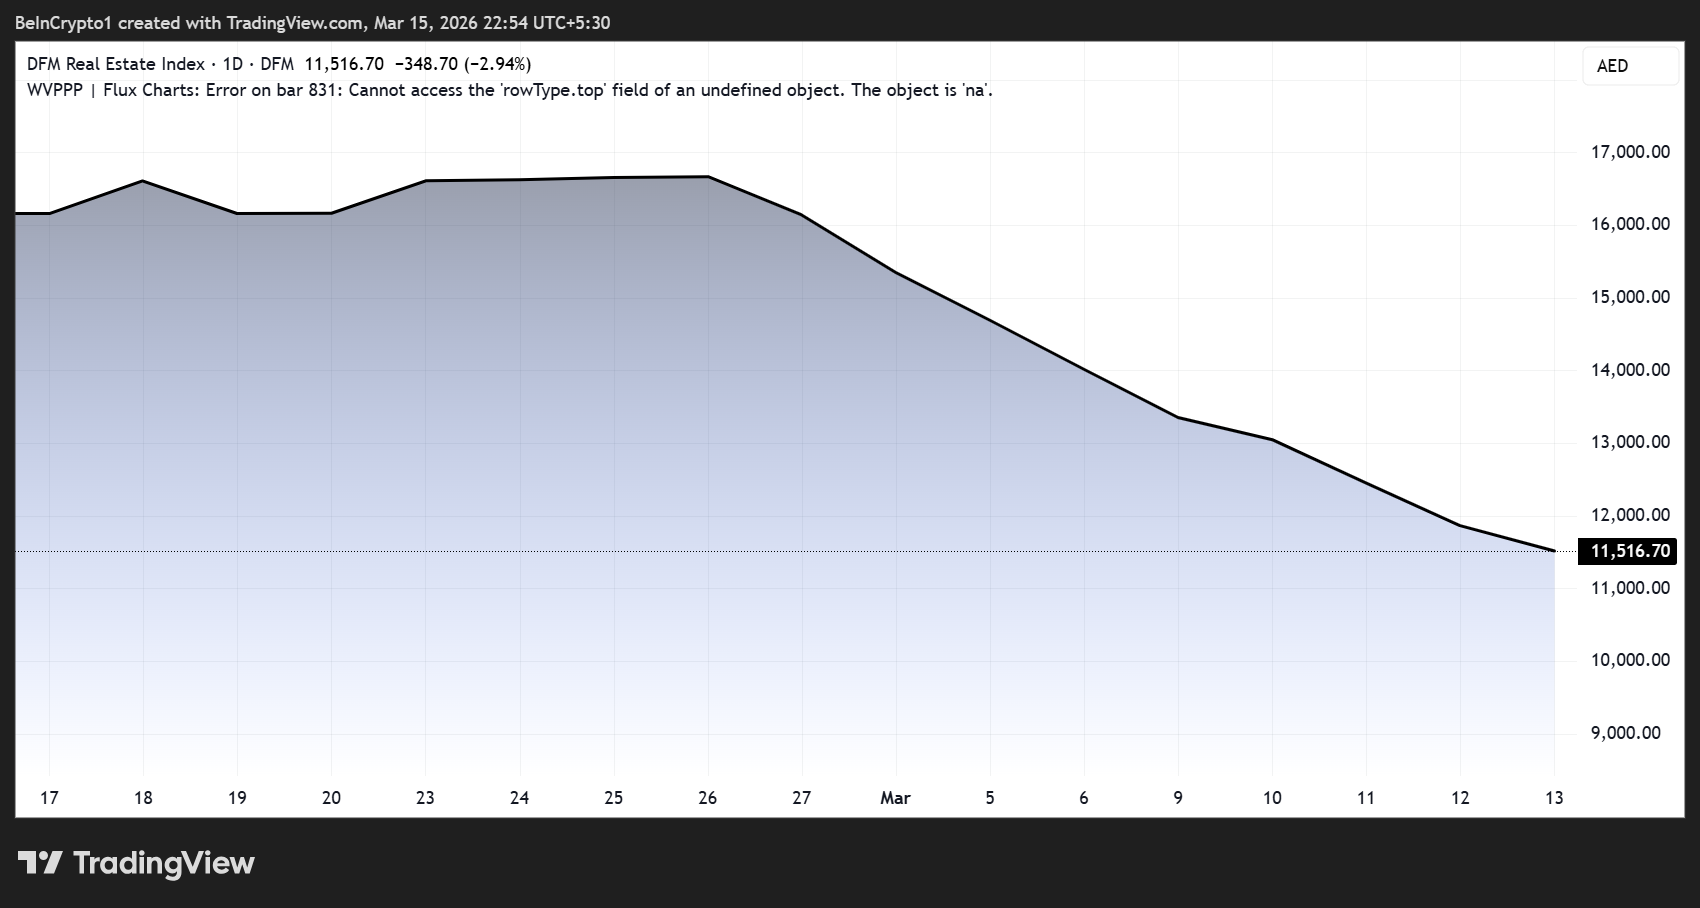 DFM Real Estate Index (DFMREI) Price Performance. Source: TradingView
Token Metrics observed that when investors in oil-rich economies move into USDC rather than traditional dollar accounts, it signals that the digital form of the dollar is competing with its physical form.
Mizuho analysts Dan Dolev and Alexander Jenkins argued in their research note that adjusted volume may matter more than market capitalization when predicting the long-term stablecoin winner.
They raised their Circle stock price target from $100 to $120, citing expanding USDC use cases in prediction markets and agentic commerce.
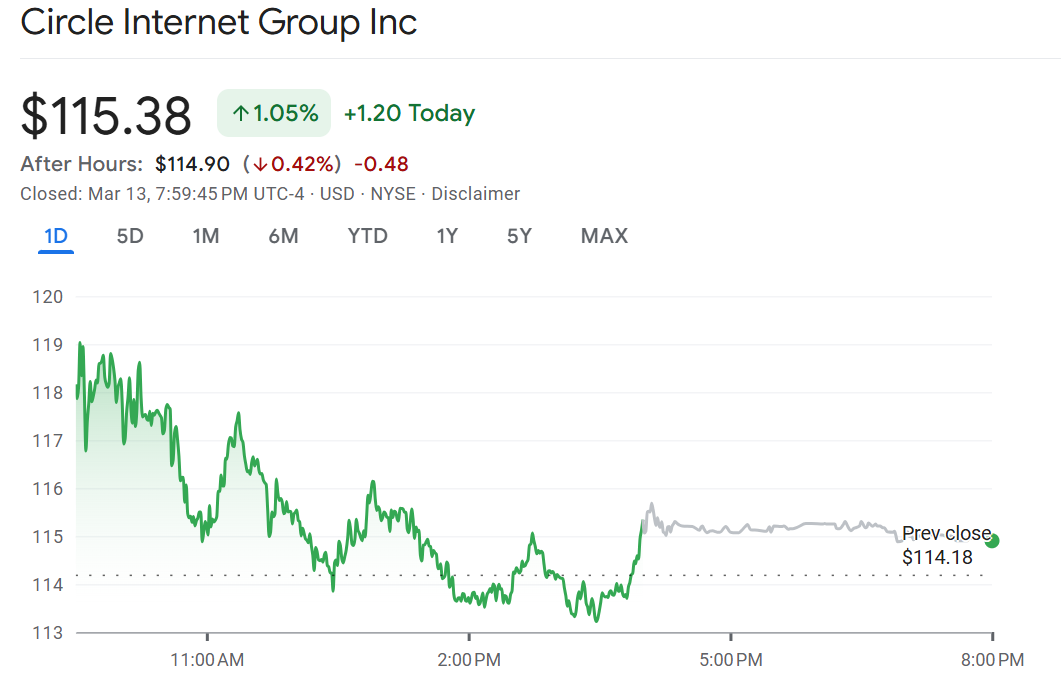 Circle (CRCL) Stock Performance. Source: Google Finance
The stablecoin market overall has reached a record $315 billion as of mid-March, reflecting growing institutional demand across both trading and non-trading applications.
Whether USDC can sustain its volume lead while narrowing USDT’s capitalization gap will depend on how quickly regulatory preferences and regional adoption patterns continue to fragment the stablecoin market.
The data from early 2026 suggest the answer may vary from one country to another.
0
0


 Manage all your crypto, NFT and DeFi from one place
Securely connect the portfolio you’re using to start.

0
0

0
0


0
0