Why Is The Crypto Market Down Today?

0
0

The total crypto market cap (TOTAL) and Bitcoin (BTC) suffered a hit over the last 24 hours as the US Producer Price Index (PPI) rose by 0.7% MoM. This led to the altcoins noting a decline as well, with LayerZero (ZRO) leading the decline, marking a 9.7% drop.
In the news today:-
- Prediction markets are pushing back US-Iran ceasefire timelines, with Polymarket showing just a 7% probability of a ceasefire by March 31 and only 53% by June 30, as the conflict continues to weigh on inflation expectations and risk assets like Bitcoin. Federal Reserve Chair Jerome Powell has flagged rising energy prices as a growing inflation risk, with the prolonged war threatening to impact rate expectations and broader financial markets.
- The SEC has approved Nasdaq’s pilot proposal to allow tokenized versions of stocks and other securities to trade alongside their traditional counterparts on the same exchange, at the same price and with identical rights. The initiative, developed in partnership with the Depository Trust Company, marks a significant step toward integrating blockchain-based asset tokenization into mainstream US financial markets.
The Crypto Market Drops
The total crypto market cap dropped $83 billion over 24 hours after US Producer Price Index data showed a 0.7% month-over-month rise, significantly exceeding the 0.3% consensus estimate. The hotter-than-expected inflation reading triggered a broad risk-off response. Bearish macroeconomic conditions amplified the selloff across the entire digital asset market.
TOTAL has fallen through the $2.45 trillion support level, now trading at $2.42 trillion and heading toward $2.37 trillion. This breakdown from a key technical floor signals renewed bearish momentum. Continued panic selling or sustained investor risk aversion could accelerate the decline toward that next major support threshold.
Want more token insights like this? Sign up for Editor Harsh Notariya’s Daily Crypto Newsletter here.
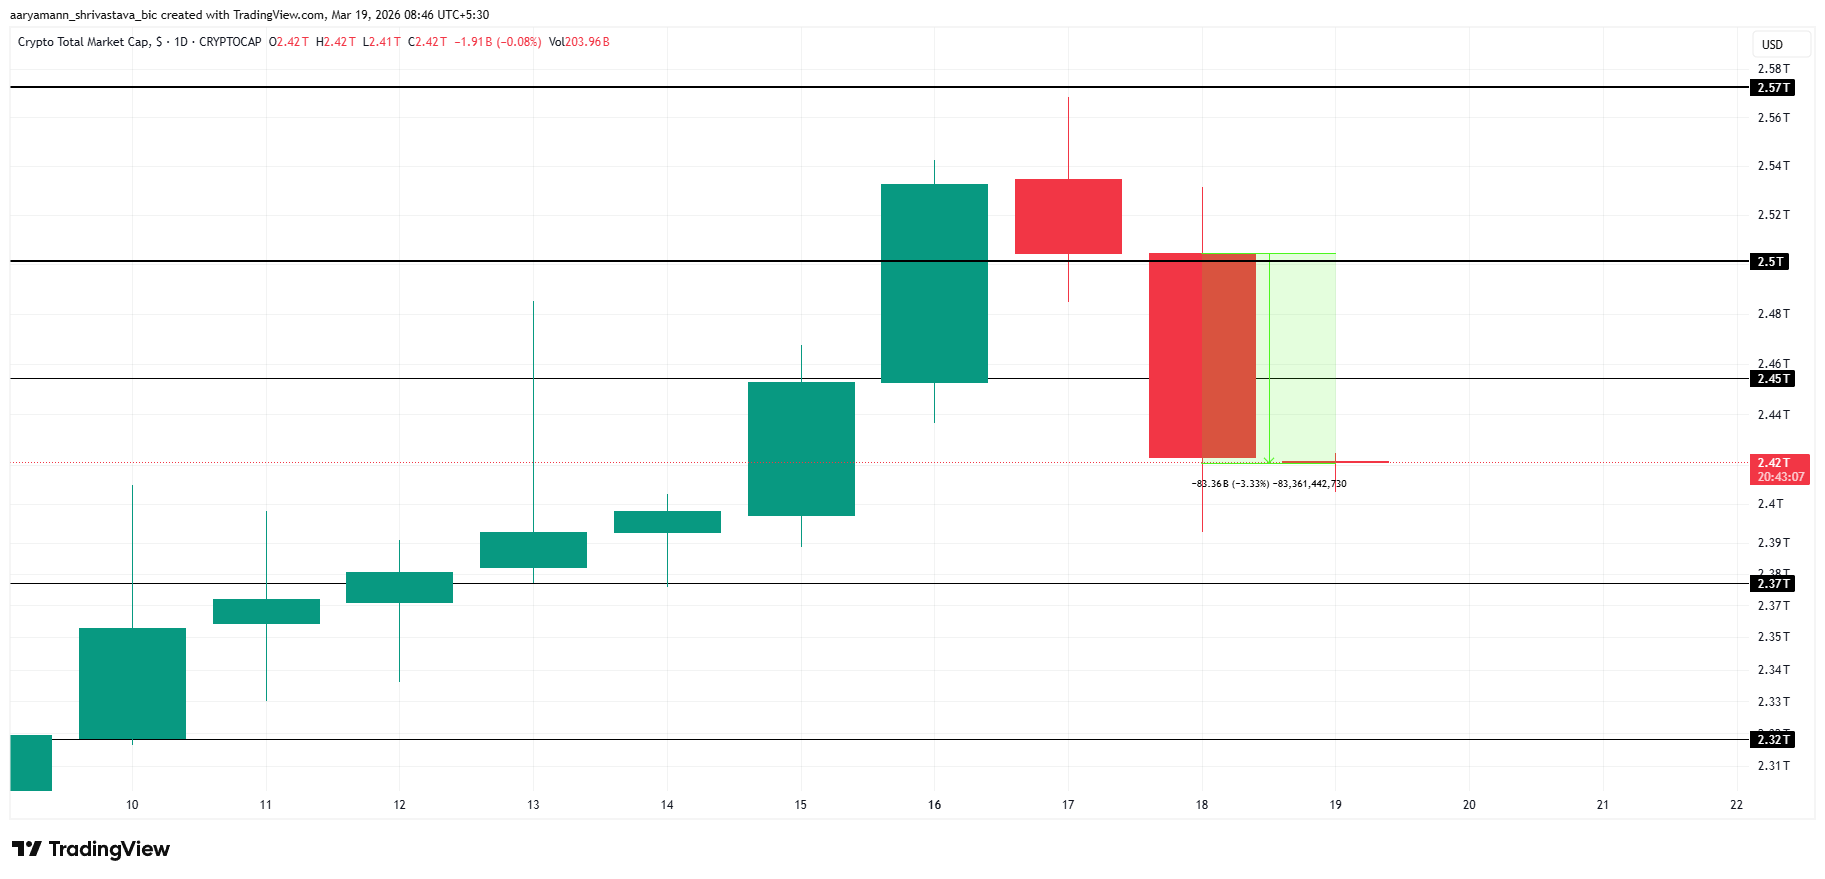 TOTAL Price Analysis. Source: TradingView
A return of bullish momentum offers a constructive recovery path. Renewed buying conviction could help the market reclaim lost ground, with flipping $2.50 trillion back into support marking the primary recovery objective. Achieving that would signal that the PPI-driven selloff has been fully absorbed and broader confidence is returning.
Bitcoin Slips To $70,000
Bitcoin is trading at $71,350 after failing to sustain a move above $75,000. The retreat was anticipated, given that the Money Flow Index crossed the 80.0 overbought threshold earlier this week, signaling bullish saturation. This technical warning preceded the current pullback, confirming that buying momentum had reached an unsustainable level.
Continued bearish pressure could push Bitcoin below the psychological $70,000 barrier and through the $68,830 support level. A breakdown at those thresholds would expose BTC to a deeper decline toward $66,224. Sustained selling momentum at current levels would confirm that the recent rally has fully exhausted its underlying buying conviction.
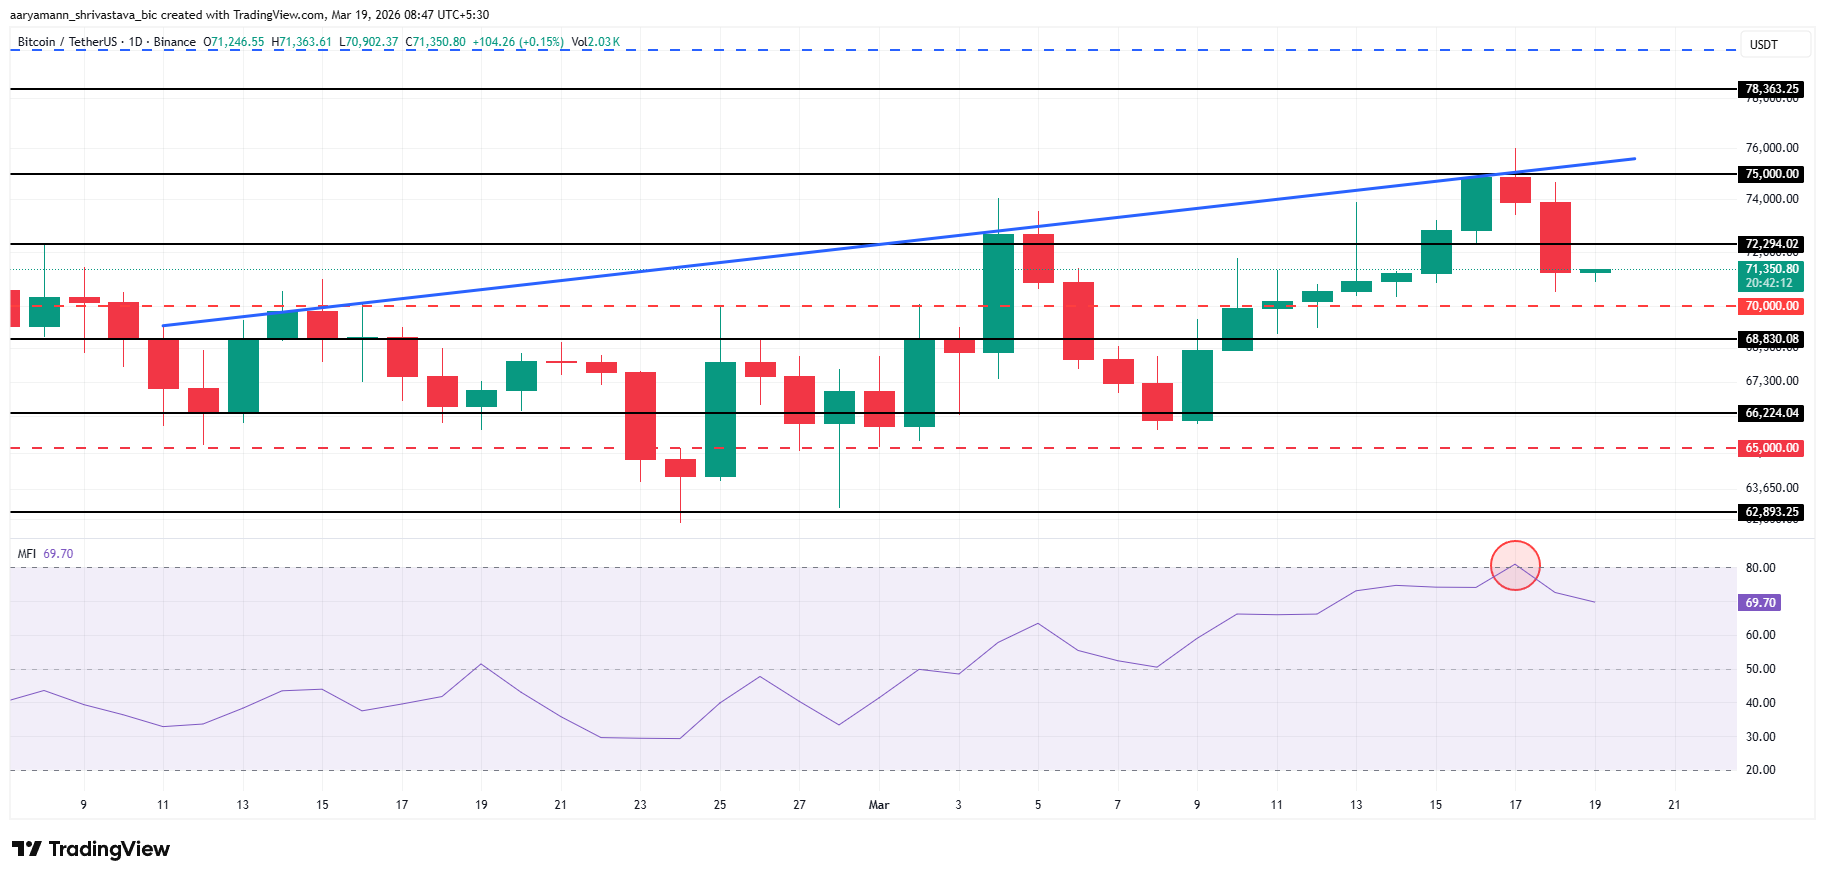 Bitcoin Price Analysis. Source: TradingView
Renewed bullish momentum offers Bitcoin a path to recovery. Reclaiming $72,294 as a confirmed support level would be the critical first step toward mounting another $75,000 attempt. A successful retest and hold above that zone would invalidate the current bearish thesis and position BTC for a stronger and more sustained breakout attempt.
LayerZero Might Slip To $2
ZRO emerged as the day’s worst-performing crypto token, dropping 9.7% over 24 hours to trade at $2.09. The decline followed a loss of the $2.15 support level, a technically significant breakdown that has shifted short-term momentum firmly in favor of bears. Selling pressure intensified once that floor gave way.
The 20-day exponential moving average could provide ZRO with critical near-term support, potentially anchoring price above the $2.00 psychological threshold. However, if broader market conditions deteriorate further, even EMA support may prove insufficient. A confirmed breakdown below that level would expose ZRO to a decline toward $1.94.
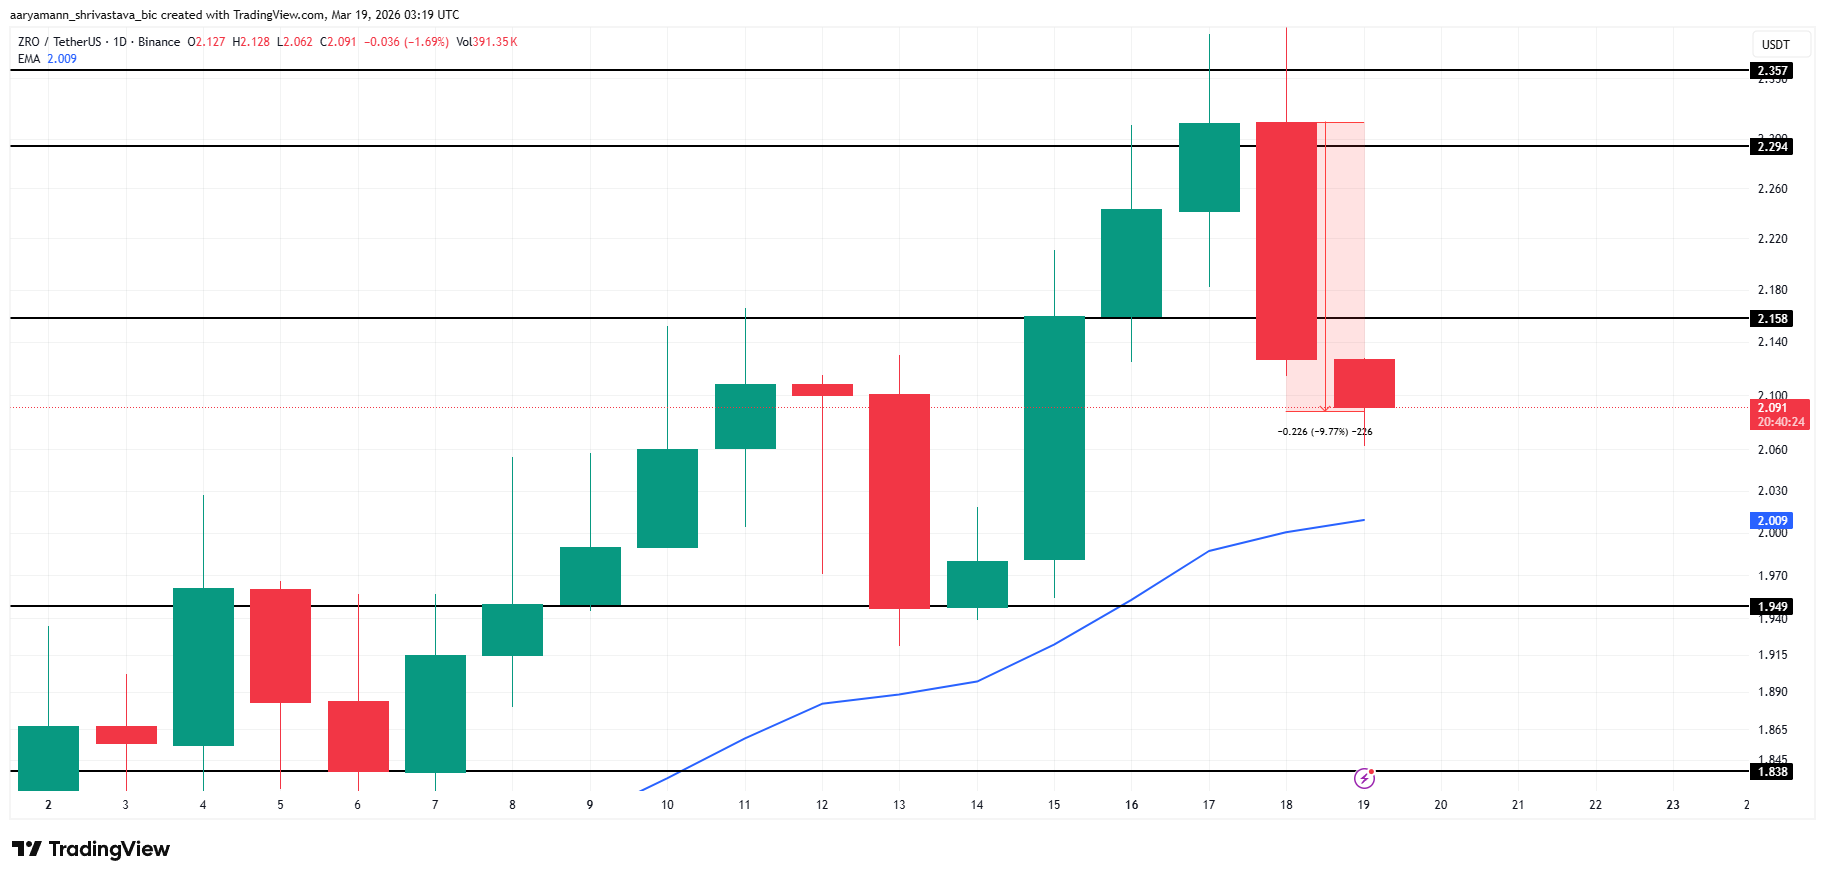 ZRO Price Analysis. Source: TradingView
Restrained selling could allow ZRO to stage a meaningful recovery. A bounce from current levels, combined with a flip of $2.15 back into support, would restore the short-term bullish structure. From there, ZRO would have a credible path toward the $2.29 resistance, fully invalidating the current bearish thesis.
0
0


 Manage all your crypto, NFT and DeFi from one place
Securely connect the portfolio you’re using to start.


