
Sui Price Prediction: Can SUI Break Out to $1.41?

0
0

This Sui price prediction comes right after a sharp reversal move.
SUI swept below a recent swing low, clearing out resting stop-losses, and then reversed hard into an aggressive push higher, all while still trading inside a falling wedge on the daily chart.
That combination is worth unpacking.
Quick Answer: Key Levels at a Glance
CMP: $0.7019, Binance SUI/USDT Perpetual, daily chart
Price just swept its recent low and reversed sharply higher inside a falling wedge
Bullish trigger: sustained daily close above $0.8289, opening the door to $1.1637 and $1.4147
Bearish invalidation: daily close below $0.6510, opening room toward $0.5670
All levels are marked off prior to swing highs and lows on the chart
Data captured: August 20, 2026
SUI Price Right Now
Metric | Value |
CMP (Current Market Price) | $0.7019 |
24-Hour Change | +7.22% |
Market Cap | $2.84 billion |
Futures Volume (24h) | $776.44 million |
Spot Volume (24h) | $118.06 million |
Open Interest | $519.44 million |
Circulating Supply | 4.07 billion |
Total Supply | 10.00 billion |
Max Supply | 10.00 billion |
Futures volume of $776.44 million against spot volume of $118.06 million works out to nearly 6.6 times more futures activity than spot, so leveraged traders are clearly driving this move rather than spot buyers.
Open interest of $519.44 million against a $2.84 billion market cap puts leverage exposure at roughly 18.3% of market cap, a fairly elevated reading that raises the odds of sharper swings in either direction.
Source: CoinGlass live market data, August 20, 2026. Chart source: TradingView, SUI/USDT Perpetual, Binance, daily timeframe.
Methodology
This prediction is built on the daily SUI/USDT perpetual chart on Binance, viewed through TradingView.
Levels are pulled directly from prior swing highs and lows marked on that chart.
The RSI panel is currently reading 52.79, sitting just above neutral and still building on the Bull signal that printed on this timeframe.
Sui Ecosystem Update: Stablecoin Growth
MSB Intel flagged that Sui's on-chain stablecoin market cap hit $465.4 million, up 4.14% over the past week.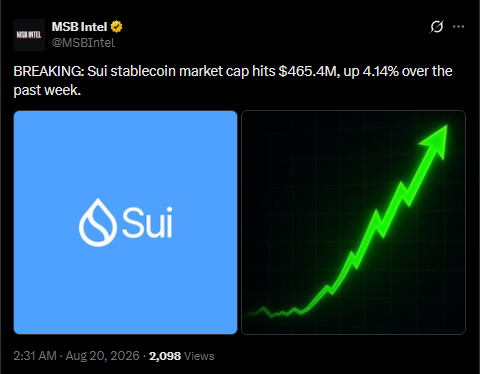
Rising stablecoin supply on a chain generally points to more capital sitting ready to deploy on that network, a modestly supportive backdrop alongside today's technical move.
Source: MSB Intel (@MSBIntel) on X, August 20, 2026, 2:31 AM.
SUI Liquidation Data Today
The 12-hour and 24-hour windows both show short-side liquidations dominating, at $1.32 million and $1.79 million, which lines up with the sharp reversal off the swept low; shorts were likely caught leaning the wrong way as price snapped back up.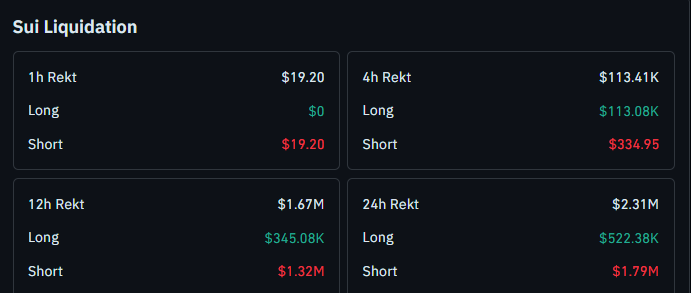
The 4-hour window flips this, with longs taking the bulk of the losses, suggesting a brief pullback right after the initial spike.
The last hour shows a small return to short-side liquidations, hinting price is trying to push higher again.
Source: CoinGlass liquidation data, August 20, 2026.
Sui Price Prediction: Daily Chart Analysis
Price is currently trading inside a falling wedge, a pattern formed by two converging downward-sloping trendlines, which typically resolves with a breakout to the upside.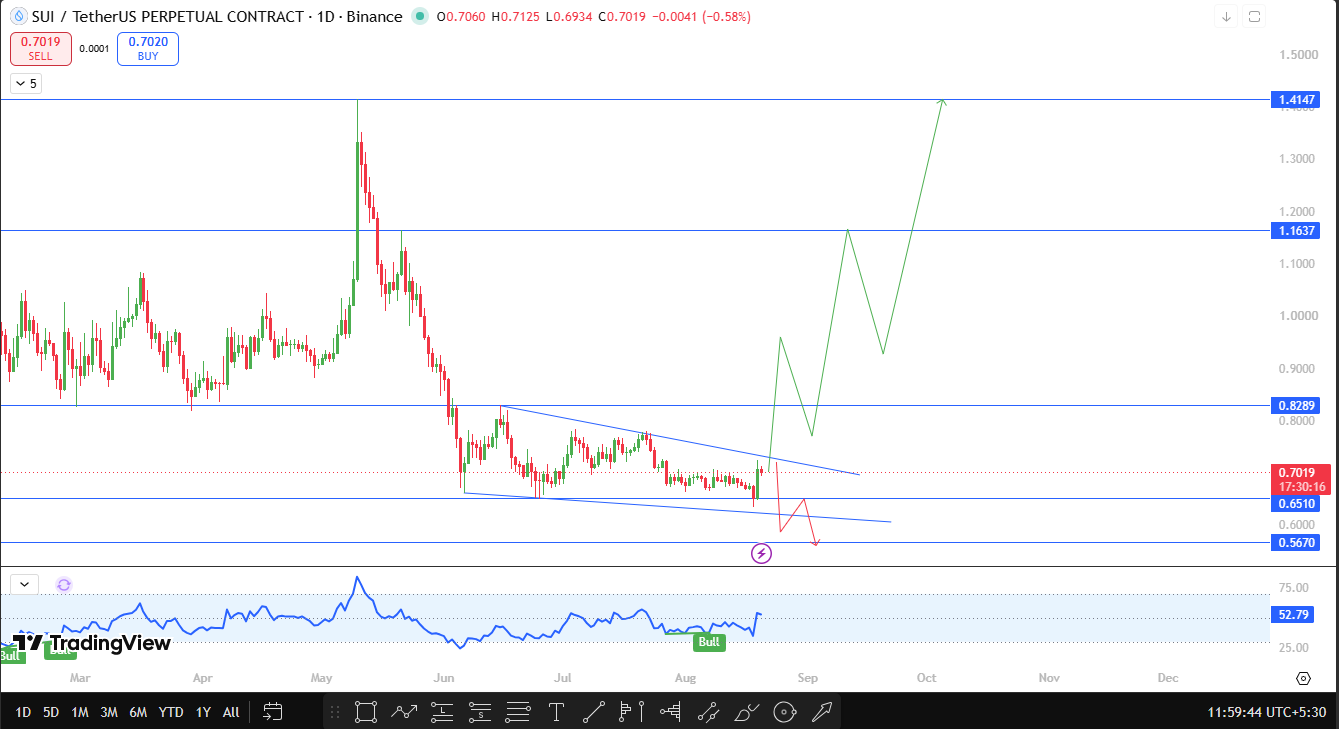
Just before this move, the price swept below a recent swing low, clearing out stop-losses, before reversing hard and pushing back inside the range, a classic liquidity sweep rather than genuine continued selling.
If price sustains this reversal and closes above $0.8289, the next levels to watch are $1.1637 and $1.4147, both marked off prior swing highs.
A daily close and hold above $0.8289 would confirm the wedge is resolving bullishly rather than just producing another lower high.
If the price instead fails and closes below $0.6510, that would invalidate the bullish scenario, with $0.5670 as the next marked support on a deeper pullback.
SUI Technical Outlook Snapshot
Indicator | Signal |
Chart Pattern | Falling wedge with liquidity sweep, daily timeframe |
RSI (TradingView, daily) | 52.79, near neutral, building on prior Bull signal |
Near-Term Bias | Bullish above $0.6510 |
$SUI Support and Resistance Levels to Watch
Level Type | Price | % From CMP | Note |
Major Resistance | $1.4147 | +101.55% | Prior swing high |
Resistance 1 (trigger) | $0.8289 | +18.09% | Wedge breakout confirmation |
Current Price | $0.7019 | 0% | Live CMP, Binance perpetual, daily chart |
Support 1 (trigger) | $0.6510 | -7.25% | Wedge breakdown / invalidation level |
Support 2 | $0.5670 | -19.22% | Prior swing low |
Risk-Reward Table
Case | Trigger | Target |
Bull Case | Sustained daily close above $0.8289 | $1.1637, then $1.4147 |
Bear Case | Sustained daily close below $0.6510 | $0.5670 |
Setup invalidation | Daily close back below $0.6510 | Wedge and sweep thesis invalidated |
Invalidation Level
This setup breaks if price closes below $0.6510 on the daily chart and stays there.
That would undercut both the wedge structure and the recent liquidity sweep, shifting focus down to $0.5670 as the next area buyers could step back in.
CoinGabbar's Technical Analyst View
Bull Case: A sustained daily close above $0.8289 confirms the wedge is resolving bullishly, opening a path toward $1.1637 and $1.4147, helped by the recent short-covering and steady stablecoin growth on Sui.
Base Case: Price holds between $0.6510 and $0.8289 as the market digests the sweep-and-reverse move before committing to a direction.
Bear Case: A close below $0.6510 undoes the reversal, opening room toward $0.5670, especially if the short-covering that drove this bounce fades and long-side liquidations pick up instead.
Disclaimer
This article is for informational purposes only and should not be treated as financial advice. Cryptocurrency markets are highly volatile, and readers should do their own research before making any investment decisions. CoinGabbar and the analyst do not hold a position at the time of publication.
0
0

 Manage all your crypto, NFT and DeFi from one place
Securely connect the portfolio you’re using to start.


