
BUILDon Price Prediction: Is B Token About To Break Out Higher

0
0

BUILDon is having one of those days that gets traders refreshing their charts every few minutes.
Why BUILDon Traders Are Suddenly Paying Close Attention
The BUILDon price prediction talk has picked up fast, and it's not hard to see why. Buyers showed up out of nowhere and pushed the $B token into a move most people were not expecting this week.
Turns out, the setup had been building quietly for days.
Charts don't move like this without a reason. Something shifted across altcoin market trends, and it shifted fast.
We pulled up the 4-hour chart, and the first thing that stood out was how sharp the recovery looked compared to the past two weeks. That's not a small detail.
Is this the start of something bigger, or just another short-lived spike before sellers step back in?
BUILDon Coin Overview and Today's Trading Snapshot
| Metric | Value |
|---|---|
| Coin Name | BUILDon |
| Ticker Symbol | B |
| Blockchain | BNB Smart Chain |
| Today High | $0.26114 |
| Today Low | $0.23158 |
| RSI Level | 74.74 |
| Token Type | Utility Token |
| Token Category | Platform / Ecosystem Token |
| Market Cap | $255.94M |
| 24H Trading Volume | $11.59M |
| 24H Trading Volume Change | +197.59% |
| Circulating Supply | 1B B |
| 24H Change | +21.55% |
Source: Data by CoinMarketCap
What Exactly Is BUILDon And Why It Exists
BUILDon runs on the BNB Smart Chain, and its native token $B powers activity across the platform's ecosystem. It's rated 4.0 by CertiK, which gives some baseline comfort to newer holders.
The project has grown its holder base to over 78 thousand wallets, helped along by community pushes like crypto airdrops, which is not nothing for a token still finding its footing.
The BUILDon Price History And How Far It Has Traveled
$B touched an all-time high of $0.7617 back in mid-May, then fell hard, down more than 66% from that peak.
But here's the flip side. From its all-time low near $0.0015 last year, the token is still up over 16,900%. That's a wild ride either way.
Why This Coin Matters Right Now In The Market
Volume tells a story numbers alone can't. Trading activity jumped nearly 198% in a single day, and that kind of spike usually means something changed.
Basically, when volume outruns price this fast, it's either fresh conviction or a short squeeze. The market will decide which one it was.
Liquidity across exchanges also widened this week, spreading interest beyond the handful of crypto exchange listings that usually carry this token.
BUILDon Liquidation Data Shows Where Traders Got Caught
| Timeframe | Total Liquidations | Long Liquidations | Short Liquidations |
|---|---|---|---|
| 1 Hour | $520.19 | $505.37 | $14.82 |
| 4 Hours | $13.50K | $1.11K | $12.39K |
| 12 Hours | $14.86K | $2.46K | $12.40K |
| 24 Hours | $37.41K | $3.95K | $33.46K |
Source: Liquidation data by CoinGlass
Short sellers took the bigger hit over the past day. And that tells us who got caught leaning the wrong way.
The BUILDon Fundamental Analysis: Supply And Demand Snapshot
The circulating supply sits at the full 1 billion B, matching the total supply. There's no hidden unlock pressure lurking here, unlike coins still working through crypto presale listings and future unlock schedules.
Fully diluted valuation matches market cap exactly at $255.94M, which keeps the fundamental picture fairly clean and easy to read.
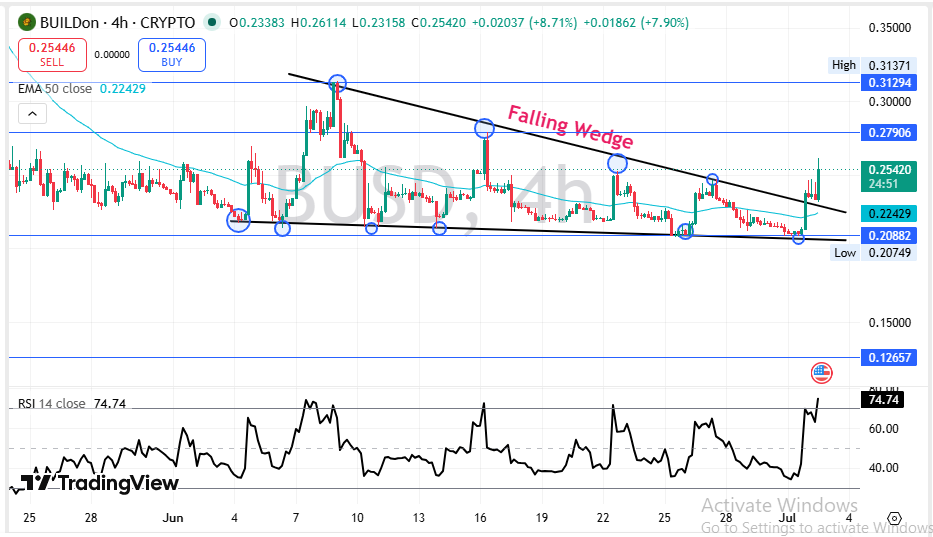
BUILDonTechnical Analysis: $B Chart Flashes A Falling Wedge Breakout Signal
The price just broke out. Right now, on the 4-hour chart, $B has pushed above a falling wedge pattern that had been squeezing price lower since late June.
Source: Charting by TradingView
Buyers stepped in hard. Volume confirmed it.
The price is trading at 0.2542, sitting well above the 50 EMA near 0.22429. That gap between price and the moving average usually signals buyers remain in control for now.
RSI sits at 74.74. That's overbought territory, and it often means a short pause or pullback could hit before the next leg up.
But momentum doesn't die instantly just because RSI is hot. Sometimes it runs longer than expected, especially when the broader Bitcoin price outlook stays supportive.
Resistance sits at 0.27906 and then 0.31294 above that.
Support holds near 0.20882, with invalidation for this bullish structure down at 0.12657.
The BUILDon Volume Heatmap Across Major Exchanges
| Exchange | 24H Volume |
|---|---|
| Binance | $5.96M |
| LBank | $2.76M |
| MEXC | $1.62M |
| BingX | $1.32M |
| Bybit | $1.16M |
| Gate | $1.13M |
| CoinEx | $1.11M |
| Bitget | $1.08M |
| KuCoin | $633.72K |
Source: Volume heatmap by CoinGlass
Binance alone carries over half of tracked volume. When one exchange dominates like that, price can swing fast on any large order there.
How BUILDon Stacks Up Against Other Small-Cap Tokens
Compared to other sub $300M market cap tokens, like the recent CAP price prediction setup, BUILDon's volume surge this week stands out. Most similarly sized coins don't see nearly 200% volume growth in a single day.
The BUILDon Short-Term Price Prediction For The Coming Weeks
The next few days will likely test whether buyers can hold above the wedge breakout zone, not unlike the pattern seen in the TAC protocol price prediction run, or whether profit-taking drags the price back toward support.
| Timeframe | Bearish Target | Base Target | Bullish Target | Key Trigger |
|---|---|---|---|---|
| 24 Hours | $0.2280 | $0.2540 | $0.2720 | RSI cooldown versus continued buying momentum |
| 3–7 Days | $0.2088 | $0.2600 | $0.2790 | Weekly close above key resistance |
| 2–4 Weeks | $0.1950 | $0.2650 | $0.3129 | Trading volume remains elevated on Binance |
Watch the 0.27906 zone closely. It's the line between continuation and a stall.
The BUILDon Long-Term Price Predictions Through 2027
Zooming out, and keeping half an eye on the coin events calendar for upcoming catalysts, the bigger question is whether B can rebuild toward its earlier highs or whether this week's move is just a bounce inside a longer downtrend.
| Timeframe | Bearish Target | Base Target | Bullish Target | Catalyst Needed |
| 3 Months | 0.1500 | 0.2600 | 0.3800 | Sustained exchange volume growth |
| 6 Months | 0.1200 | 0.3000 | 0.4500 | New exchange listings or partnerships |
| End of Year | 0.1000 | 0.3300 | 0.5200 | Broader altcoin market recovery |
| 2027 Outlook | 0.0900 | 0.3800 | 0.6500 | Ecosystem adoption beyond the current user base |
Honestly, the long-term case is not proven yet. It needs real follow-through, not just one strong week.
Three BUILDon Price Scenarios Traders Should Prepare For
Worst Case: Sellers reclaim the wedge zone, and the price falls back under 0.20. Broader market weakness accelerates that drop.
Base Case: The price consolidates between 0.22 and 0.28 while the market digests this week's volume spike.
Best Case: A confirmed breakout above 0.31294 opens room toward the prior high near 0.45, backed by strong sustained volume.
| Scenario | Price Range | What Triggers It |
|---|---|---|
| Worst Case | Below $0.20 | Wedge breakout fails and sellers regain control |
| Base Case | $0.22 – $0.28 | Sideways consolidation after the recent rally |
| Best Case | Above $0.31 | Breakout confirmed with strong trading volume |
Key BUILDon Price Levels Every Trader Should Watch
Resistance zone: 0.27906, and above that, 0.31294. A close above both would confirm the breakout is real.
Support zone: 0.20882. This has held multiple times and remains the level bulls need to defend.
Invalidation zone: 0.12657. A close below this would break the current bullish structure entirely.
BUILDon Analyst View And Final Thoughts On Where It Heads
The chart setup right now favors buyers, at least in the short term. A falling wedge breakout with rising volume is not something to dismiss.
RSI at 74.74 does raise caution, though. Some cooldown is normal and shouldn't be read as a trend reversal on its own.
A weekly close above 0.27906 would be the clearest signal that this move has real legs. Anything less keeps this in bounce territory.
One factor to track beyond the chart: overall market risk appetite, visible in tools like the fear and greed index. If broader crypto sentiment turns, even strong individual setups can stall.
The 0.20882 support level remains the single most important number on this chart. Lose it, and the bullish case falls apart quickly.
The setup looks more constructive than most traders are giving it credit for right now.
Disclaimer: This article is for educational purposes only and does not constitute financial advice. Crypto markets are volatile. Consult your investment advisor before making any investment decision.
0
0

 Manage all your crypto, NFT and DeFi from one place
Securely connect the portfolio you’re using to start.