
Ethereum Price Prediction: Is ETH Set to Break or Crash Today?

0
0

Ethereum now sits right at a level that could decide its next move: the $1,901 zone. Steady ETF inflows and a mixed derivatives picture add extra weight to the setup here.
What Is ETH's Price Doing Today?
ETH last changed hands around $1,890.50, down close to 1.67% over the past 24 hours. On the daily chart, the coin opened at $1,878.38, hit a high of $1,909.80, and closed near $1,892.74.
Market cap sits near $228 billion. Futures volume over the past day reached $37.79 billion, while spot volume stayed lighter at $1.62 billion. That gap points to leverage-driven trading rather than spot demand.
Where Are ETH's Key Support and Resistance Levels?
ETH is boxed in between a cluster of support levels below and resistance walls above. The table below lays out the zones traders are watching most closely.
Level Type | Price Zone (USD) | Basis |
Resistance | $2,018-$2,388 | Broader breakout target |
Resistance | $1,980-$2,060 | Hourly channel top |
Resistance | $1,936 | 100-day EMA |
Key Pivot | $1,901 | Currently being retested |
Support | $1,842-$1,850 | 20-day EMA, channel floor |
Support | $1,832 | 50-day EMA |
Support | $1,800 | Stronger support floor |
Risk Zone | $1,803-$1,827 | Possible correction target |
Is ETH's Rising Channel Still Holding?
On the daily chart, ETH has been climbing inside a rising channel since its June lows, even while a longer downtrend line from earlier this year still sits overhead.
Price recently slipped below the short-term trend line but didn't stay down for long. Buyers stepped back in fast, pushing the coin back up to retest the $1,901 resistance zone.
That retest matters most. If ETH manages 4-hour closes above $1,901 and holds it as support, the recent dip could turn out to be a bear trap, not a real breakdown.
In that scenario, a move toward $1,950 to $2,000 opens up. But if price gets rejected at $1,901 again and drops back under the rising trend line, the $1,803 to $1,827 zone comes back into play as the next likely stop.
The daily Ichimoku cloud adds another wrinkle. ETH was recently rejected there and slipped below the broader downtrend line, so current support needs to hold or price risks sliding back toward the cloud's lower edge.
Momentum is leaning mildly positive for now. Daily RSI sits near 58, with stochastic readings close to 60, both pointing to modest bullish momentum rather than a strong trend either way.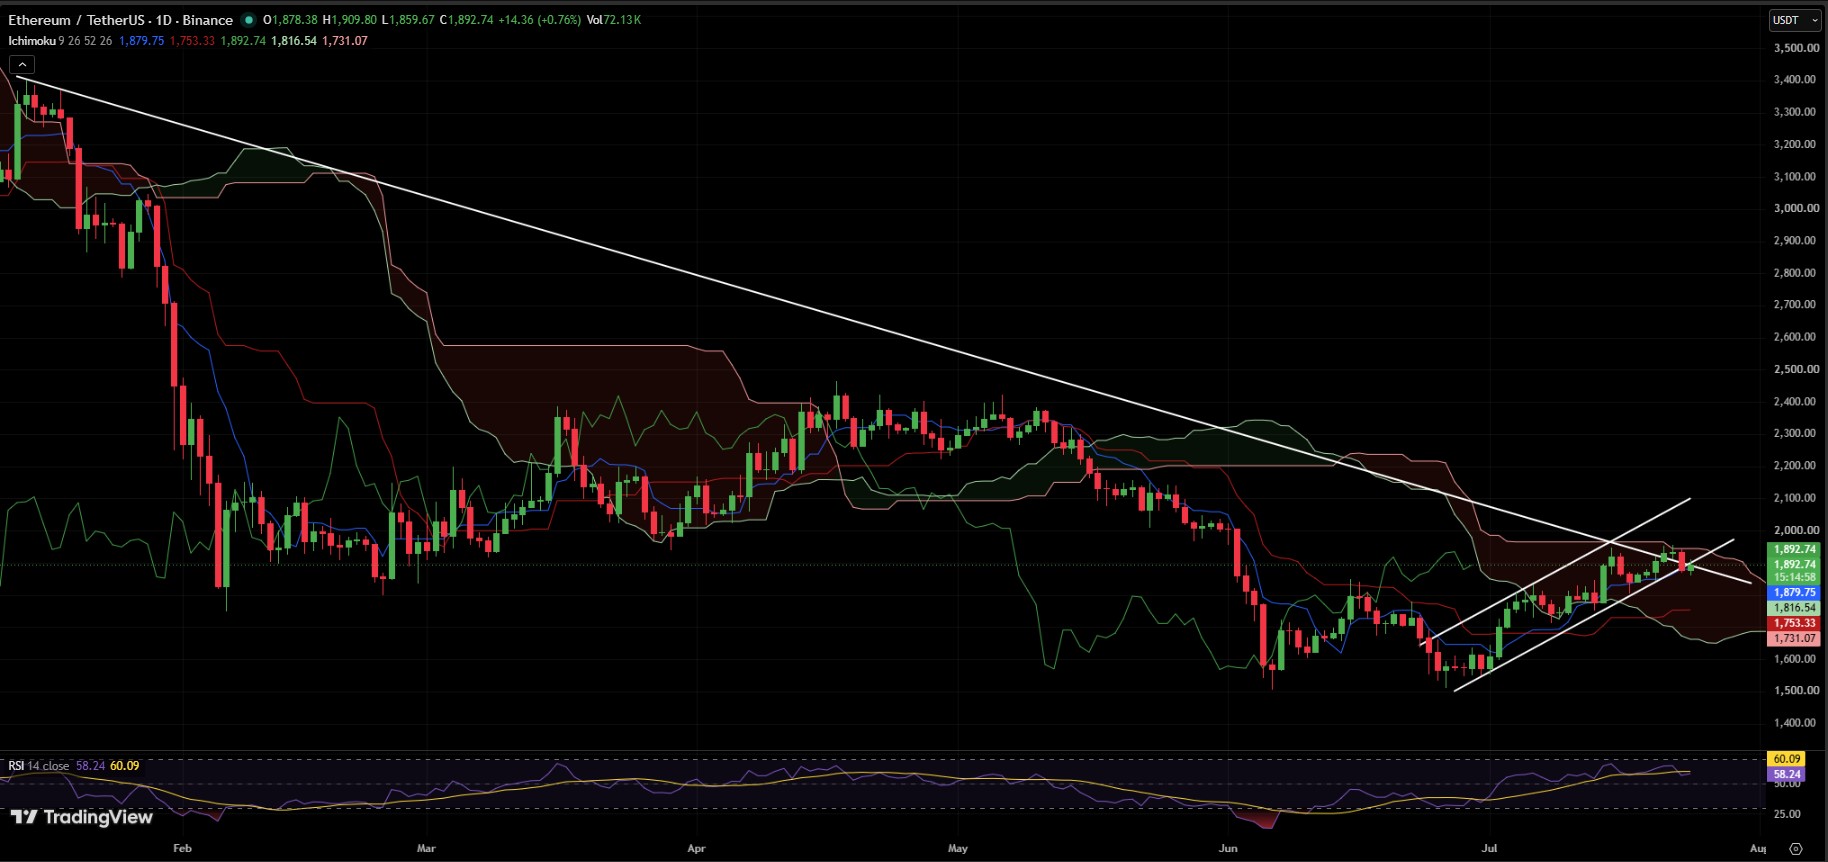
Are Ethereum ETF Inflows Still Rising?
Spot Ethereum ETFs in the US just logged a fifth straight day of net inflows. On July 23, funds added $26.32 million, bringing cumulative inflows to roughly $11.25 billion since launch.
Date | Daily Net Inflow | Cumulative Net Inflow | Net Assets |
Jul 23, 2026 | $26.32M | $11.25B | $10.32B |
Jul 22, 2026 | $72.64M | $11.23B | $10.57B |
Jul 21, 2026 | $37.47M | $11.15B | $10.48B |
Jul 20, 2026 | $38.09M | $11.12B | $10.29B |
Jul 17, 2026 | $36.73M | $11.08B | $9.97B |
Net assets across these funds now sit near $10.32 billion. Inflows stayed positive all week even as the spot price barely moved, which hints that institutional buyers may be accumulating quietly while retail traders stay cautious.
Elsewhere, Japan is reportedly drafting rules for its first Bitcoin ETF by 2028, with pension funds already said to be exploring crypto exposure.
It's a Bitcoin headline for now, but it echoes the same institutional interest showing up in ETH's ETF flows.
What Do Leverage and Liquidation Data Show for ETH?
Derivatives data paints a mixed picture. The 24-hour long/short ratio sits near 0.95, giving short positions a slight edge. On Binance, though, the account-level long/short ratio runs above 2, meaning smaller traders are still leaning bullish overall.
Metric | Value |
24h Long/Short Ratio | 0.95 |
Binance L/S Ratio (Accounts) | 2.22 |
OKX L/S Ratio (Accounts) | 1.63 |
Total Liquidations (24h) | $73.19M |
Long Liquidations | $48.62M |
Short Liquidations | $24.57M |
Liquidations have picked up too. Roughly $73.19 million in positions were wiped out over the past 24 hours, and longs took the bigger hit at $48.62 million against $24.57 million for shorts.
That imbalance points to long-side leverage building up, which could fuel a sharp move once $1,901 breaks either way.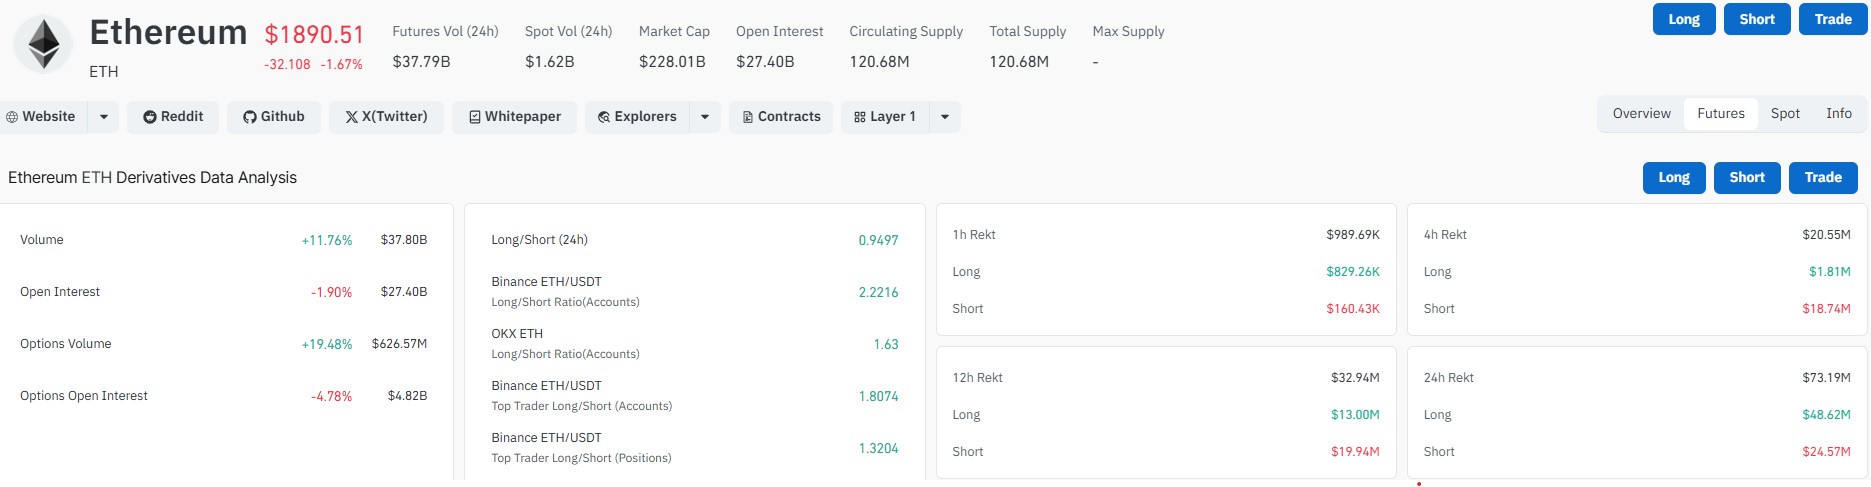
Ethereum Price Forecast: What's Next for ETH?
The next move looks tied to whether $1,901 flips from resistance into support. A confirmed break and retest could open a path toward $1,936 and then the $1,980 to $2,060 zone flagged on shorter-term charts.
A rejection here keeps the $1,832 to $1,850 support band in focus, with bigger risk toward $1,803 to $1,827 if the rising channel breaks down.
Neither outcome is confirmed yet. The dip below the trend line wasn't enough to settle things on its own, so acceptance above $1,901 will likely decide where ETH heads next.
Disclaimer: This article is for informational purposes only and does not constitute financial, investment, or trading advice. Cryptocurrency prices are highly volatile and can move sharply in either direction without warning. Past performance and chart patterns do not guarantee future results. Always do your own research and speak with a licensed financial advisor before making any investment decisions.
0
0

 Manage all your crypto, NFT and DeFi from one place
Securely connect the portfolio you’re using to start.


0
0

0
0