
Shiba Inu Price Prediction: Vitalik's Burn Legacy Meets SHIB Breakout

0
0
This Shiba Inu price prediction starts with a bit of background. Shiba Inu launched in August 2020, created by an anonymous developer known online as Ryoshi.
The project drew its name and mascot from the Shiba Inu dog breed, the same meme that inspired Dogecoin a few years earlier, and it was often nicknamed the "Dogecoin killer" in its early days.
What started as a single meme token has since grown into a small ecosystem, adding a decentralized exchange called ShibaSwap and a layer-2 network named Shibarium built to support faster, cheaper transactions.
SHIB itself remains the project's original and most widely held token.
Shib currently trading around $0.00000521, up 0.7% over the last 24 hours. That puts SHIB's market cap at roughly $3.073 billion, keeping it ranked #33 among all cryptocurrencies.
Live Market Data
Metric | Value |
Price | $0.00000521 |
24h Change | +0.7% |
24h Range | $0.00000505 – $0.00000524 |
Market Cap | $3.073B |
Fully Diluted Valuation | $3.075B |
24h Trading Volume | $64.341M |
Circulating Supply | 589.239T |
Total Supply | 589.496T |
Source: SHIB market cap data taken from CoinGecko, data as of Sep 03, 2026. Figures may vary slightly across other tracking websites.
Exchange Volume
SHIB's futures volume is spread across a wider mix of exchanges than some larger-cap tokens. 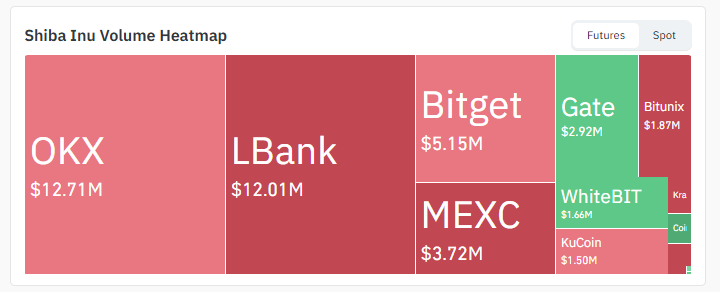
Source: Volume Heatmap Data Taken From CoinGlass, As of Sep 3, 2026
OKX leads with $12.71M over 24 hours, closely followed by LBank at $12.01M.
Bitget adds $5.15M, MEXC contributes $3.72M, and Gate, Bitunix, WhiteBIT, and KuCoin round things out in the $1.5M to $3M range each. No single venue dominates the order flow here the way it does on some other pairs.
Shiba Inu Coin News
Crypto news outlet BSCN recently posted about SHIB's supply history.
According to the tweet, SHIB's anonymous creator sent half of the token's entire one-quadrillion supply, unsolicited, to Ethereum co-founder Vitalik Buterin back in 2020. 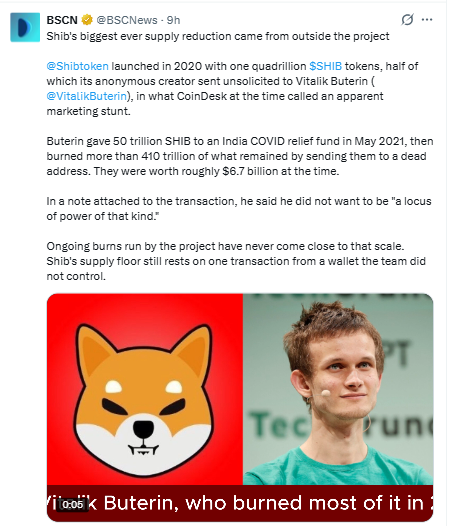
Source: Data Taken From @BSCNews, X Account, As of Sep 03, 2026
In May 2021, Buterin donated 50 trillion of those tokens to an India COVID relief fund and burned more than 410 trillion of what remained, a batch worth roughly $6.7 billion at the time.
He explained the decision by saying he didn't want to be "a locus of power of that kind."
The tweet notes that no burn run by the project itself has come close to that scale since, meaning SHIB's supply floor still traces back to a transaction the team never controlled.
Technical Analysis for Shiba Inu Coin
From Descending Channel to Ascending Channel
SHIB's chart has gone through a fair bit of shape-shifting lately. Price first broke out of the top of a descending channel, which triggered a sharp move higher.
That rally got rejected, and SHIB spent the next stretch building a falling wedge instead. 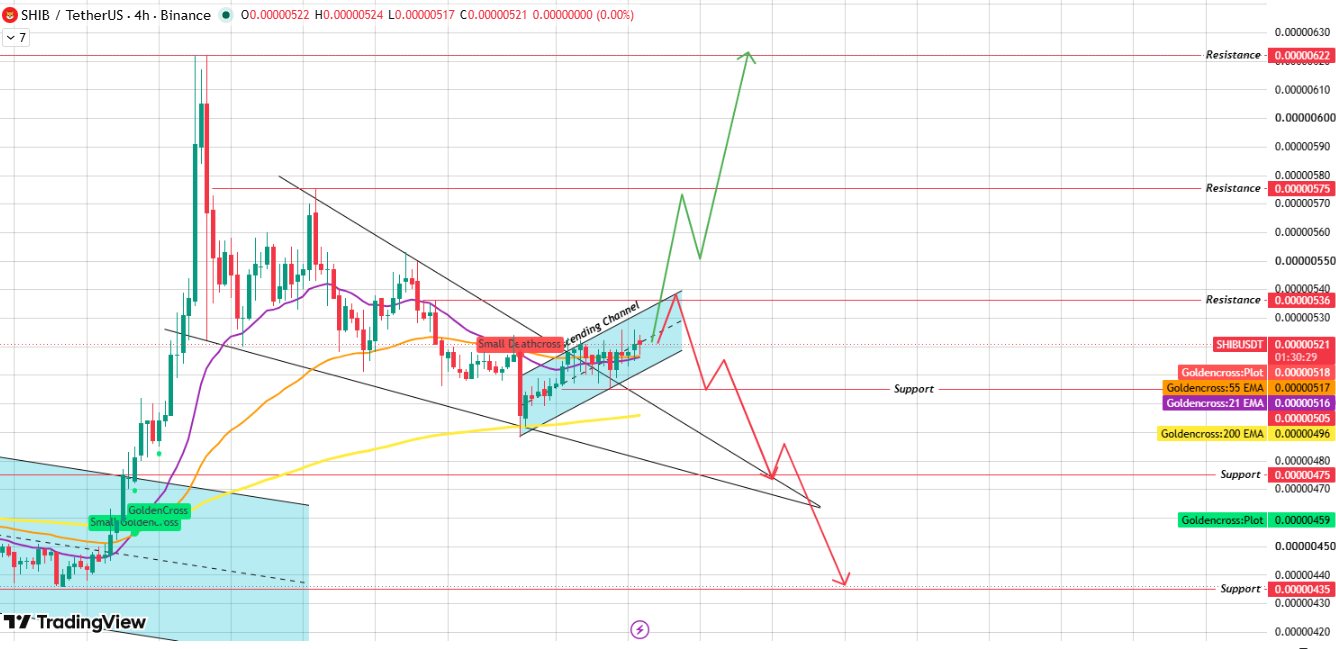
Source: Chart Taken From TradingView, As of Sep 3, 2026
It broke that wedge's upper trendline too, and what's formed since then is a new ascending channel on the 4-hour timeframe.
Three structural breaks in a row, each one resolving to the upside, tend to say something about underlying demand, and it's the core reason this Shiba Inu price prediction leans constructive in the near term.
EMA Position
Price is currently trading above all three EMAs on the chart: the 21-period at $0.00000516, the 55-period just above it at $0.00000517, and the 200-period further below at $0.00000496.
The pullback that formed the current channel tested both the 21 and 55 EMAs directly and held there, which is generally read as a sign that buyers haven't lost control of the shorter-term trend.
Breakout and Rejection Scenarios
If SHIB manages a 4-hour close above the ascending channel's upper boundary near $0.00000536, with volume stepping up to confirm it, $0.00000575 becomes the first level and $0.00000622 the one after that in this $SHIB price prediction.
The alternative isn't hard to picture either.
A rejection at that same boundary, followed by a close below the channel's rising lower edge, would flip the setup to bearish, with $0.00000475 as the first support to watch and $0.00000435 sitting underneath it.
EMA Levels (4H Chart)
EMA | Price |
55-period EMA | $0.00000517 |
21-period EMA | $0.00000516 |
200-period EMA | $0.00000496 |
Levels reference the 4-hour candle close on the SHIB/USDT chart, Binance, UTC.
Support and Resistance Levels (4H Chart)
Level Type | Price |
Resistance 3 | $0.00000622 |
Resistance 2 | $0.00000575 |
Resistance 1 | $0.00000536 |
Support 1 | $0.00000475 |
Support 2 | $0.00000435 |
Bull, Base, and Bear Case for SHIB
Scenario | Trigger | Price levels |
Bull Case | The 4-hour candle closes above the ascending channel's upper boundary near $0.00000536 with volume above the recent average. | $0.00000575, then $0.00000622 |
Base Case | SHIB keeps rotating inside the ascending channel, holding between the EMA cluster and the upper boundary. | Range-bound roughly between $0.00000516 and $0.00000536 |
Bear Case | Price is rejected at $0.00000536, fails to hold the EMA cluster, and closes below the channel's rising lower boundary. | $0.00000475, then $0.00000435 |
Descending and ascending channels both trap the price between two parallel trendlines; the difference is just which way the whole structure is tilted.
A breakout of either one, especially with volume, tends to carry real weight for what comes next.
Falling Wedge: A pattern where both boundary lines slope downward but converge toward each other, often resolving with an upside break once the range gets tight enough.
The EMA cluster refers to a group of exponential moving averages sitting close together on the chart. When price holds above that cluster during a pullback, it's often treated as a sign that short-term trend strength hasn't broken down.
Circulating Supply: The portion of a token's total supply that's actually out and tradeable, as opposed to locked, reserved, or otherwise unavailable.
Burning tokens means removing them from circulation permanently, typically by sending them to an address no one holds the keys to.
$SHIB's project-level burns are ongoing but small next to the 2021 event described above, which happened entirely outside the team's control.
Disclaimer: This Shiba Inu price prediction is based on technical chart analysis and publicly available market data, and it is not financial advice. SHIB remains a high-supply, high-volatility asset, and price could fall well below the support levels discussed here if broader market sentiment turns negative or the ascending channel fails. Historical events like the 2021 burn don't guarantee similar supply-side surprises in the future. Do your own research and weigh your own risk tolerance before making any decisions.
0
0


 Manage all your crypto, NFT and DeFi from one place
Securely connect the portfolio you’re using to start.


