Solana Price Faces Crucial Test at $100 as Downside Risk Builds Below $80—What’s Next?

0
0
The post Solana Price Faces Crucial Test at $100 as Downside Risk Builds Below $80—What’s Next? appeared first on Coinpedia Fintech News
Solana price is trading just above the critical $100 support after failing to sustain moves above the $118–$120 supply zone, placing the market at a critical turning point. Price has compressed into a narrow range between $100 and $108, reflecting indecision after the recent sell-off. With previous demand clustered near $92–$95 and no strong follow-through buying above $110, traders are now questioning whether $100 can continue to hold.
Will dip buyers defend this level, or does a daily close below $98 open the door toward deeper downside? The next few sessions are likely to define Solana’s near-term trend.
The daily SOL chart shows Solana testing a critical demand zone after a prolonged downtrend, with price slipping to the $100–$103 region. This area has historically acted as a strong accumulation zone, making the current structure pivotal for the next medium-term move. While broader momentum remains weak, early signs suggest selling pressure may be nearing exhaustion, setting the stage for a potential relief bounce or base formation.
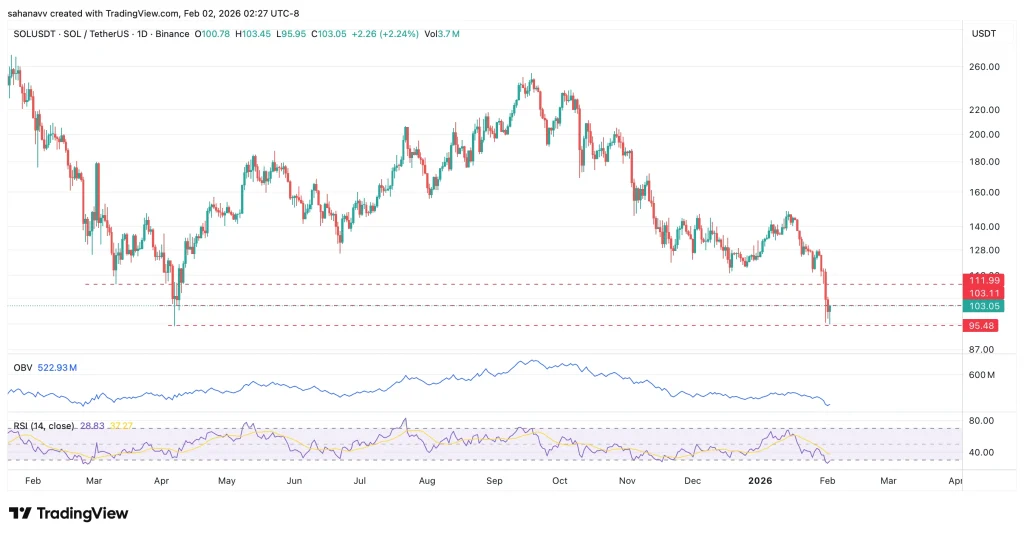
From a price-action perspective, SOL has formed lower highs and lower lows since the October peak near $260, confirming a dominant bearish trend. The recent sharp sell-off resembles a capitulation move, as the price wicked close to the $95–$100 support band.
- RSI (14) is near 28–30, deep in oversold territory, hinting at a possible short-term rebound.
- OBV continues to trend lower, indicating weak accumulation and cautioning that any bounce may initially be corrective.
- The horizontal support zone between $95 and $103 is crucial; a sustained breakdown below this range would expose deeper downside.
Heading into February 2026, Solana’s price action remains at a make-or-break zone. As long as $100 holds on a daily closing basis, the market may attempt a relief rebound toward $108–$112, where supply has consistently capped upside. However, a confirmed close below $98 would weaken the structure and shift focus toward the $92–$95 demand band, followed by a deeper downside risk toward $85 if selling accelerates. Momentum remains fragile, and February is likely to be defined by range resolution rather than trend expansion, unless volume returns decisively on either side of the $100 level.
0
0

 Manage all your crypto, NFT and DeFi from one place
Securely connect the portfolio you’re using to start.


0
0


0
0