
Dogecoin Price Prediction: $DOGE Coils Near Apex as Key Levels

0
0

This dogecoin price prediction has to start with where $DOGE stands today: close to $0.07012, right at the point where the shorter-term chart has coiled into a wedge.
That's a long way from its all-time high near $0.73, and it doesn't look like a coin trending anywhere right now.
It looks compressed. Shiba Inu and Pepe are stuck in similar chop, but DOGE's price band has narrowed more than most. Everyone's just waiting for it to snap one way or the other.
DOGE Price Snapshot
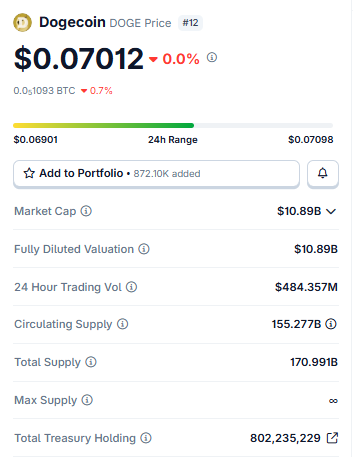
Source: DogeNetwork Market Cap Data Taken From Coingecko, data as of July 30, 2026. Figures may vary slightly across other tracking websites.
Dogecoin Liquidation Heatmap
Longs have been taking the bigger hit on the liquidation heatmap, and it isn't close. 24-hour. 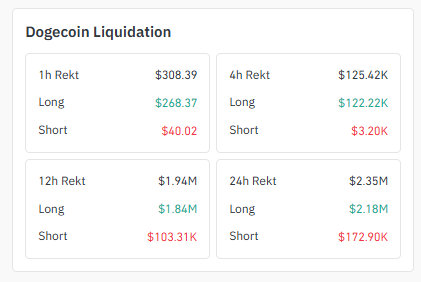
Source: liquidation data taken from Coinglass
Long liquidations sit near $2.18M against just $172.90K on the short side, meaning over-leveraged longs got cleared out during this pullback.
Dogecoin Exchange Volume Heatmap
Most of the exchange volume sits in two venues. Binance leads at $295.19M, and OKX follows at $192.43M, with MEXC and Bybit trailing near $89.14M and $80.01M. 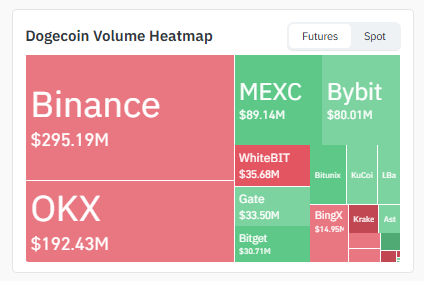
Source: Volume heatmap data taken from Coinglass
That concentration means price action on those two exchanges tends to set the tone for DOGE's next move.
4H Chart: Tightening Into the Apex
The 4-hour chart tells a simple story. $DOGE has carved out a symmetrical triangle, and the price now sits right at the apex, usually the point where a coin either breaks out or stalls out completely.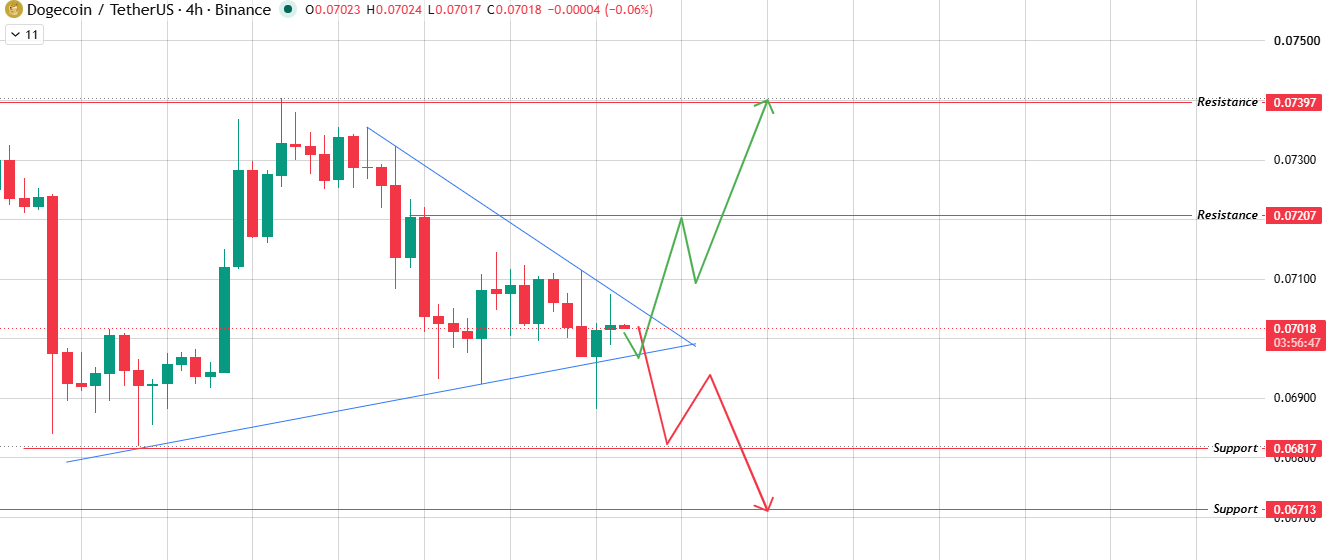 Source: Chart Taken From TradingView.
Push through the upper boundary on decent volume and $DOGE could run toward the resistance level at $0.07207, with a stronger move clearing $0.07397.
Slip through the lower boundary instead, and the support zone at $0.06817 comes into play, with $0.06713 waiting underneath as the next floor.
1D Chart: Descending Channel Under Pressure
Zoom out to the daily chart, and $DOGE trades inside a descending channel, hugging the lower half after tracing a Wolfe Wave-style structure. 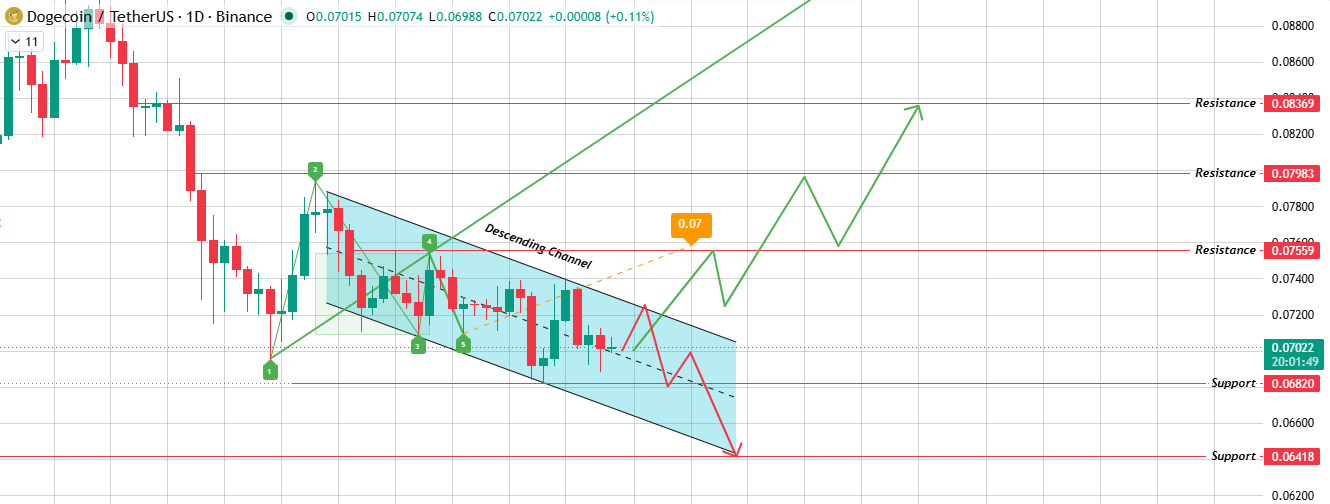
Source: Chart Taken From TradingView.
A volume-driven push above the channel's upper boundary would target $0.07559 first, with trendline support holding underneath, then $0.07983 and $0.08369 further out.
If buyers can't hold the breakout, price risks drifting back to the lower support level at $0.06820, with $0.06418 as the deeper floor.
Worth flagging: the Wolfe Wave pattern here suggests a real breakout tends to run further than a quick bounce.
Three-Scenario Outlook
Dogecoin ETF and 2026 Forecast Backdrop
There's also a story off the chart. The Dogecoin ETF angle has been quietly shaping sentiment.
Spot products like 21Shares' TDOG and Grayscale's GDOG just logged their first net inflows in over a month, per recent Dogecoin News today coverage.
Source: Data According to sosovalue.
That feeds into the wider Dogecoin Price Prediction 2026 conversation, split into two camps: a base case near current levels and a bull case leaning on renewed dogecoin bull run trends if ETF demand and altcoin sentiment recover together.
It's context, not a replacement for the technical dogecoin breakout analysis above.
Key Takeaways
-
DOGE sits near $0.07012, squeezed at the tip of a tightening pattern.
-
Whichever way volume tips it, clear levels wait on both sides.
-
This dogecoin price prediction sticks to price action and positioning data, not hype.
Holder Concentration
Holder concentration hasn't moved much through this consolidation. Tracked treasury and large-wallet balances sit near 802 million DOGE combined, with no sharp swings either way, pointing to a wait-and-watch mood among bigger players.
BTC Dominance & ETH Correlation
BTC dominance has stayed fairly firm, keeping a lid on altcoin momentum broadly. DOGE's ETH correlation sits in the moderate range, tracking the wider market to a point but still capable of moving on its own once its chart triggers fire.
Expert Opinion
$DOGE is basically holding its breath right now at the sharpest point of this triangle, and the setup rewards patience more than prediction.
Any dogecoin forecast worth trusting has to respect that.
A bullish breakout above $0.07207 backed by real volume is the cleanest signal on the table, while a bearish breakdown under $0.06817 flips the picture fast.
Glossary
A symmetrical triangle is a coin narrowing its price swings between two converging trendlines, like winding up a spring before it lets go.
A descending channel is when price keeps printing lower highs and lower lows inside two parallel sloping lines.
Support and resistance? Just the floor and ceiling prices tend to be respected, until they aren't.
Methodology
This analysis rests on price chart patterns, liquidation data, and volume data, with nothing extrapolated beyond what the current chart structure shows.
Levels can shift as new price action comes in.
Disclaimer: This DogeNetwork price prediction is for informational and educational purposes only and should not be considered financial or investment advice. Cryptocurrency markets are highly volatile, and prices can change rapidly. Always conduct your own research and consult a qualified financial advisor before making any investment decisions.
0
0


 Manage all your crypto, NFT and DeFi from one place
Securely connect the portfolio you’re using to start.

0
0


0
0

0
0