Solana (SOL) Price Analysis: $88 Bull Trap Triggers Full Range Rotation

0
0
This article was first published on The Bit Journal.
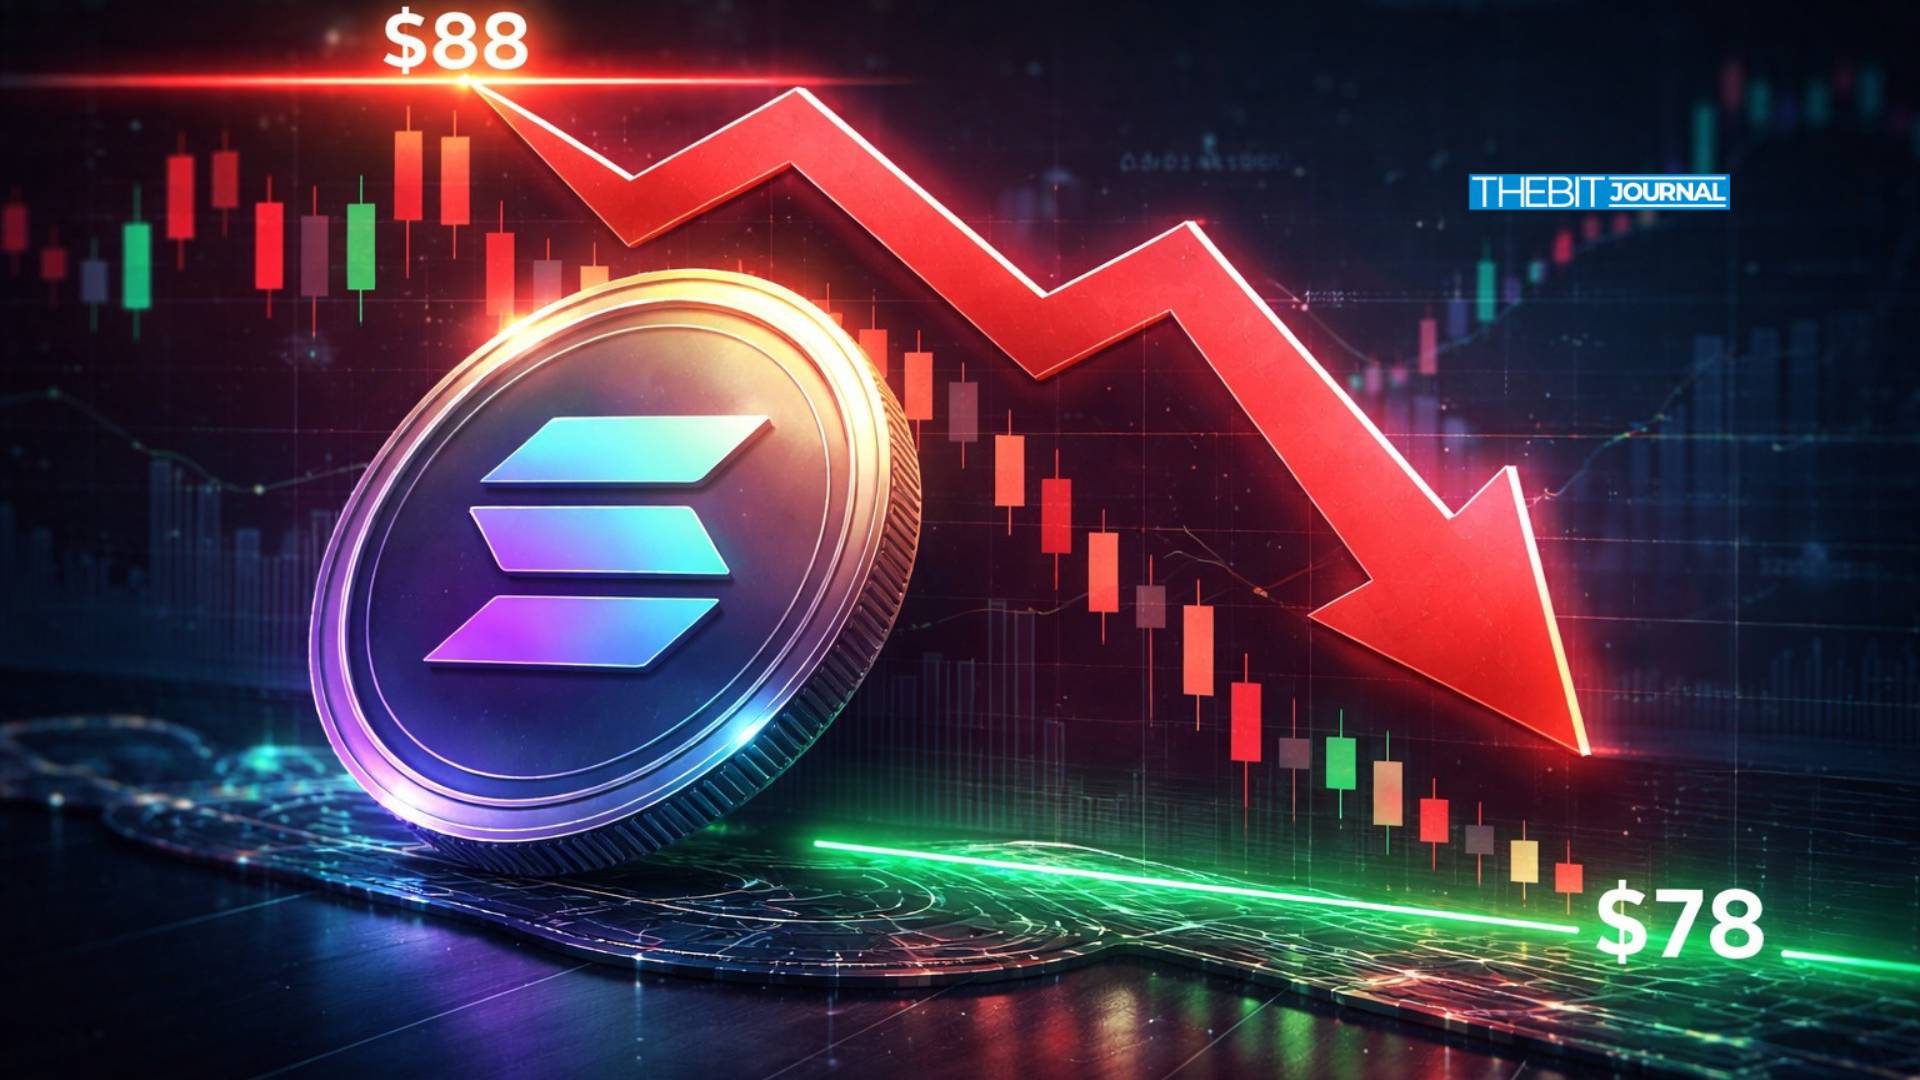
Solana price has entered a corrective phase after failing to hold above a major resistance zone. The recent breakout attempt above $88 quickly reversed. That move confirmed a bull trap and shifted short-term momentum in favor of sellers.
Solana price failed to sustain acceptance above high-timeframe resistance. The rejection at the point of control signaled renewed weakness. Price is now rotating toward the $78 support region.
Institutional Inflows Grow as Solana Price Tests Support
Institutional exposure to Solana-linked products has increased. Tokenized real-world asset value on the network has reached a record high.
Technically, the Solana price has moved back into its prior trading range. The failed breakout changed market structure in the short term. Traders are now focused on how price behaves near key support.
At the same time, institutional filings and on-chain data show growing ecosystem adoption. This creates a contrast between weak short-term price action and improving structural fundamentals.
Failed Breakout Above $88
The recent rally pushed the Solana price above the value area high. Price briefly traded near the $88 resistance zone. However, the move lacked follow-through. Buyers failed to maintain control at higher levels.
Instead of consolidating above resistance, price reversed sharply. This pattern is typical of a bull trap. Breakout traders enter on strength. When price falls back into the range, they exit positions quickly. That exit often accelerates downside momentum.
| Month | Min. Price | Avg. Price | Max. Price | Change |
|---|---|---|---|---|
| Feb 2026 | $ 86.98 | $ 94.04 | $ 104.08 |
21.85%
|
| Mar 2026 | $ 103.37 | $ 116.60 | $ 126.27 |
47.83%
|
| Apr 2026 | $ 122.10 | $ 124.25 | $ 125.85 |
47.34%
|
| May 2026 | $ 114.82 | $ 119.29 | $ 123.12 |
44.14%
|
| Jun 2026 | $ 116.88 | $ 122.32 | $ 128.76 |
50.74%
|
| Jul 2026 | $ 106.99 | $ 112.82 | $ 116.76 |
36.70%
|
| Aug 2026 | $ 113.58 | $ 117.03 | $ 120.27 |
40.81%
|
| Sep 2026 | $ 114.74 | $ 115.94 | $ 120.74 |
41.36%
|
| Oct 2026 | $ 116.95 | $ 121.88 | $ 126.18 |
47.73%
|
| Nov 2026 | $ 116.98 | $ 119.39 | $ 122.10 |
42.95%
|
| Dec 2026 | $ 114.60 | $ 115.66 | $ 116.69 |
36.62%
|
The failure above $88 marked an important shift. High-timeframe resistance often acts as a turning point. The rejection suggests supply remains strong in that region.
Rejection at the Point of Control
After falling back into the prior range, Solana price attempted to stabilize near the point of control. The point of control represents the price level with the highest traded volume within the range.
Price failed to reclaim that level. Sellers rejected the move again. This rejection confirms that the market has shifted from balance to imbalance.
When price fails at the point of control after a breakout attempt, it increases the probability of a full range rotation. That scenario now places lower support levels in focus. The short-term bias remains cautious while price trades below that area.
$78 Support and Fibonacci Confluence
The next major level sits near $78. This region aligns with high-timeframe support. It also matches the lower boundary of the broader trading range.
Just below $78 lies the 0.618 Fibonacci retracement level. Fibonacci retracements often attract price during corrections. When multiple technical levels align, reactions tend to be stronger.
If Solana price reaches this zone, volatility may increase. Liquidity often clusters near prior support. Traders will watch for signs of stabilization or further breakdown.
 Price Analysis: $88 Bull Trap Triggers Full Range Rotation 1")
Potential for a Swing Failure Pattern
The $78 region is not only a downside target. It is also a possible inflection zone. Markets often test liquidity below visible support before reversing.
If Solana price sweeps below $78 and quickly reclaims the level, a swing failure pattern could form. Such a move would signal a liquidity grab rather than a confirmed breakdown.
A strong reclaim with rising volume could shift short-term momentum. However, failure to hold that zone may open the path to deeper retracement levels.
Institutional Exposure Expands
Despite the correction, institutional activity linked to Solana has increased. Morgan Stanley disclosed holdings of 932,922 shares worth $15.30 million in the Bitwise Solana Staking ETF (BSOL), according to a Form 13F filing.
The firm also reported exposure to Solana Co.. It purchased 86,105 HSDT shares as of December. These disclosures reflect continued institutional allocation to Solana-related products.
Such filings add credibility to long-term ecosystem growth. Institutional participation often supports deeper liquidity and broader adoption over time.
Record Growth in Tokenized Assets
On-chain data shows expansion in real-world asset tokenization on Solana. Tokenized value on the network reached an all-time high of $1.66 billion, according to RWA.xyz.
This growth highlights rising interest in blockchain-based settlement systems. Solana’s low transaction costs and high throughput support such use cases.
In parallel, BlackRock’s BUIDL fund recorded significant inflows following integration with Uniswap. This development underscores the increasing overlap between traditional finance and decentralized infrastructure.
 Price Analysis: $88 Bull Trap Triggers Full Range Rotation 2")
Market Structure Remains Cautious
From a technical perspective, Solana price remains under pressure while trading below the value area high and the point of control. Short-term rallies may face resistance until bullish acceptance returns.
Market structure currently favors testing lower support. However, strong reactions at key levels could alter that outlook. Traders are monitoring price behavior closely rather than relying on a single directional bias.
Conclusion
Solana price has shifted into a corrective rotation after a failed breakout above $88. The bull trap and rejection at the point of control confirm short-term weakness. Attention now centers on the $78 support zone and the 0.618 Fibonacci level.
While institutional exposure and tokenized asset growth support the broader ecosystem, technical signals favor caution in the near term. The reaction at $78 will likely define the next major move for Solana price.
Appendix: Glossary of Key Terms
Bull Trap: A false breakout through the resistance that rapidly shifts momentum to the downside, trapping buyers.
Value Area High (VAH): The high price limit of a trading range with the most volume.
Point of Control (POC) – the price level with maximum volume within range.
Fibonacci Retracement (0.618): A major technical indicator used to identify support or resistance during retraces.
High-Timeframe Support: A significant support level that can be found on the higher timeframes, e.g., the daily or weekly timeframe.
Range Rotation: Price action between two bounds of a trading range.
Swing Failure Setup (SFP): A short-term breach of a level of support or resistance followed by recovery/resumption, indicating likely reversal.
Frequently Asked Questions About Solana Price
1- Why did Solana price reverse after breaking above $88?
The breakout lacked sustained buying pressure. Price failed to hold above resistance, confirming a bull trap.
2- Why is $78 considered important?
It aligns with high-timeframe support and the 0.618 Fibonacci retracement. Such confluence zones often trigger strong reactions.
3- Does institutional exposure support long-term growth?
Institutional filings show increased allocation to Solana-linked products, which may strengthen long-term confidence.
4- Can Solana prices recover quickly?
A strong reclaim of support with volume confirmation could trigger a bounce. Sustained recovery would require acceptance above key value levels.
References
Disclaimer:
This article is for informational purposes only and does not constitute financial advice. Cryptocurrency prices are volatile. Investors should conduct their own research before making trading decisions.
Read More: Solana (SOL) Price Analysis: $88 Bull Trap Triggers Full Range Rotation">Solana (SOL) Price Analysis: $88 Bull Trap Triggers Full Range Rotation
0
0

 Manage all your crypto, NFT and DeFi from one place
Securely connect the portfolio you’re using to start.


0
0

0
0
