Why is Bitcoin Price Struggling Near $70K? Will It Continue Falling?

0
0
The post Why is Bitcoin Price Struggling Near $70K? Will It Continue Falling? appeared first on Coinpedia Fintech News
Bitcoin price is hovering near the $70,000 mark in early February 2026, a strong drawdown from the late-January highs near $90K. The selloff was sharp, confidence faded quickly, and now the market is stuck watching one range obsessively and that is $60K to $65K. Lose that, and things could get messy fast in shortterm.
The damage along the way is already clear. Multiple support levels failed during the drop, forcing traders into a wait-and-see mode. Big bets are on pause. Everyone wants proof that a short-term bottom actually exists before stepping back in.
Fear Dominates as Structure Stays Bearish
Now is a time when every investor and trader wants a clear view, not a sugarcoating. To them sentiment has turned really ugly and a position without knowing the risk could create serious consequences.
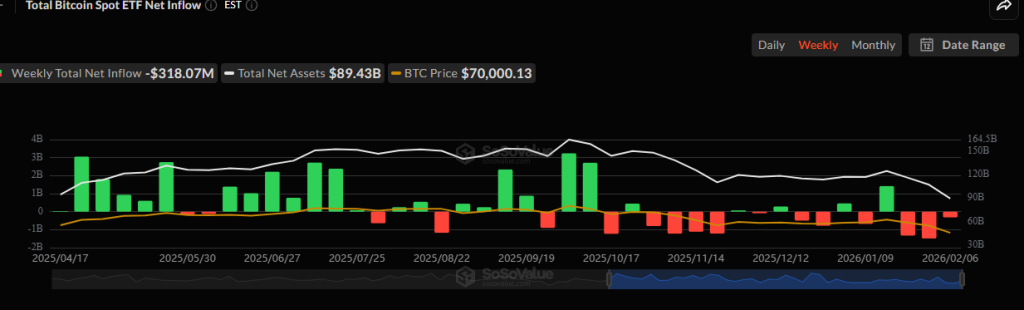
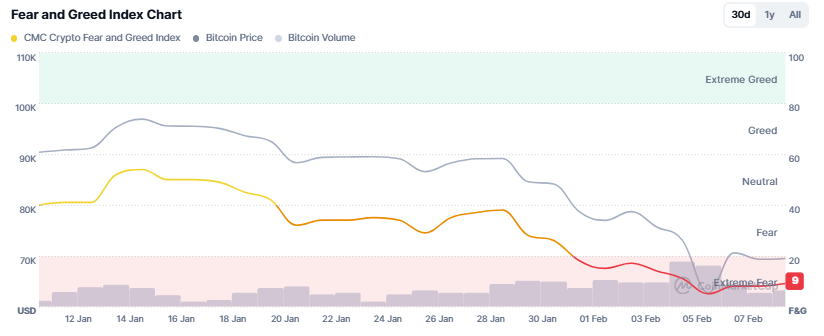
Because, the Crypto Fear and Greed Index still remains deep in Extreme Fear territory. At the same time, spot Bitcoin ETFs continue to bleed capital, with weekly flow data showing persistent outflows stretching back from September 2025 and extending into early February. That’s not the backdrop of a confident market.
Zoom out on the Bitcoin price chart and the technical picture lines up with the mood. The 50-day EMA is still below the 200-day EMA, keeping the death cross active since mid-November. Adding to the pressure, a short-term death cross between the 20-day and 50-day EMAs printed in late January, confirming near-term weakness.
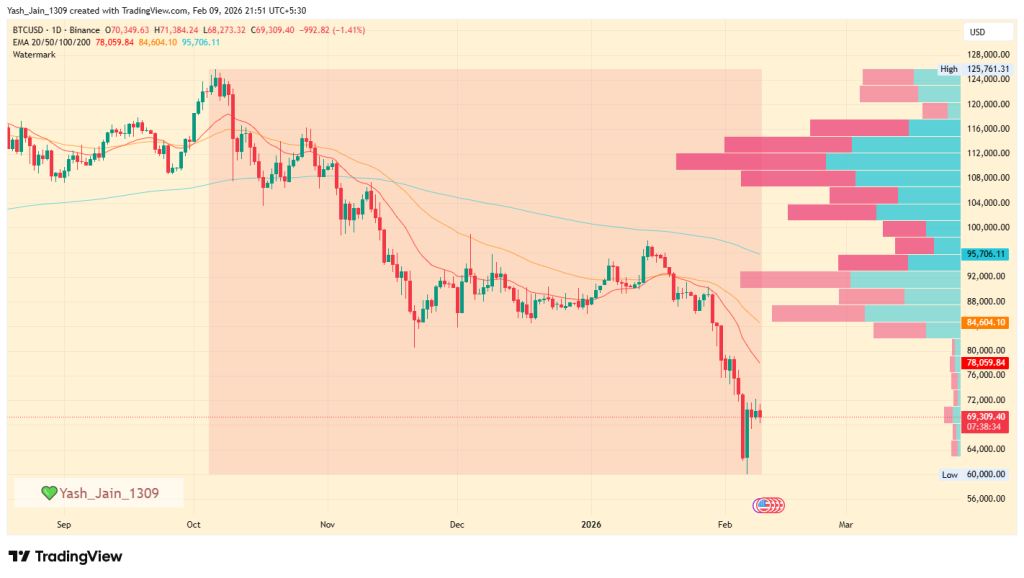
As a result, traders now treat the $60,000–$65,000 zone as the last meaningful cushion. A clean break there could invite forced selling rather than measured exits.
Short-term Indicators Hint at Relief, Cautiously
That said, not everything is screaming collapse, at least not on the daily timeframe.
RSI on the daily chart is recovering from deeply oversold levels and currently sits near 32.5, suggesting selling pressure may be losing some intensity on daily timeframe chart. Meanwhile, MACD remains in a bearish cross, but the gap between signal lines is narrowing. In plain terms, downside momentum is slowing with recent bullish move in past few days.
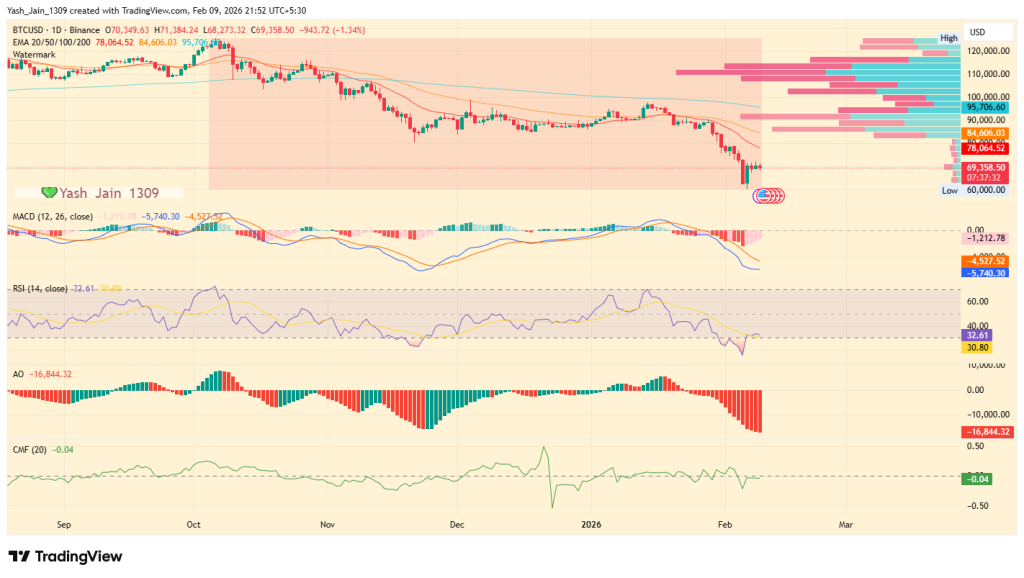
CMF, however, is still negative at around –0.05. Until it flips above the zero line, money flow doesn’t support a sustained bounce. This keeps any Bitcoin price prediction in the “short-term relief only” category rather than any kind of trend reversal not even in the shortterm view.
Leverage Tells a More Dangerous Story
Derivatives data adds another layer of concern. As per Santiment data, the Open Interest has been falling seamleslly from 30 days high of 38 million OI to only 20 billion OI positions, while BTC price struggles, a sign that traders are exiting positions rather than committing fresh capital.
The brief funding spike on February 6 looked dramatic, but it functioned more like a short squeeze than genuine demand. Once funding flipped back to positive, the market became crowded with over-leveraged longs.
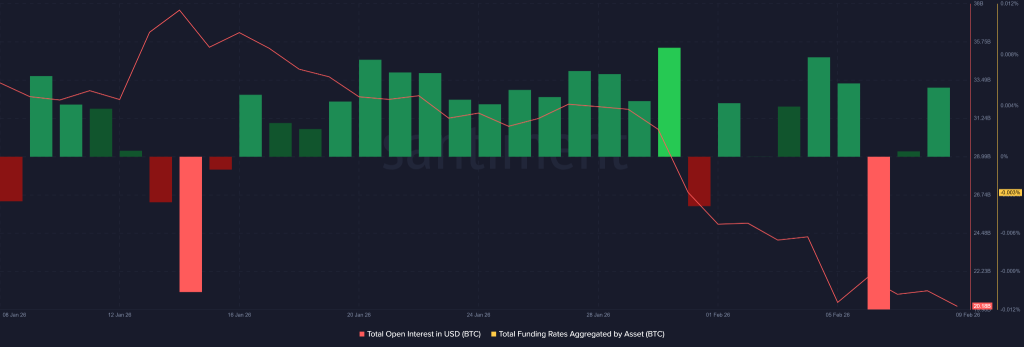
That’s the trap. Positive funding without rising participation leaves buyers exposed. Without new money entering, even a modest dip could trigger liquidations, dragging Bitcoin/USD back toward lower support.
For now or this month, Bitcoin price may attempt a bounce toward $74,750 or even $84,900 if buyers show up decisively. But until the 200-day EMA near $95,700 is reclaimed, the broader structure stays tilted firmly toward the bears.
0
0

 Manage all your crypto, NFT and DeFi from one place
Securely connect the portfolio you’re using to start.


