A Repeating Bitcoin Price Drop Pattern Just Started Its Third Act

0
0

Bitcoin (BTC) price trades near $67,044 on April 3, sitting inside a falling parallel channel on the 4-hour chart that has contained every swing since March 17.
The channel has already produced two sharp drops following a similar path. The first measured 11.49%, the second 9.72%. A third leg is now building from the early April swing high, with 5% of the move already complete. A hidden bearish divergence on the RSI suggests the current correction has further to go, while on-chain data shows that short-term participants have not yet reached the capitulation depth needed to mark a floor.
Two Drops Followed a Path, and The Third Is Underway
Since March 17, Bitcoin price has been trading inside a descending parallel channel on the 4-hour chart. The structure has followed a repeating path where each swing from a local high traces a similar trajectory of lower highs and lower lows before accelerating into a sharper decline.
The first completed drop began from the March 17 high and measured 11.49%. The second began from the subsequent lower high and fell 9.72%. Both followed a comparable shape, rallying briefly inside the channel before breaking lower.
The third leg is now forming. From the early April’s local high, BTC price has already corrected approximately 5%. If this leg follows the path of the previous two, a drop in the 9-11% range from the swing high would go lower.
The Relative Strength Index (RSI), a momentum oscillator, supports the case that the third leg has more room. Between March 22 and April 2, price made a lower high while RSI made a higher high on the 4-hour chart. That is a hidden bearish divergence, a pattern that typically appears during corrections and confirms that the existing downtrend is likely to continue rather than reverse.
Want more token insights like this? Sign up for Editor Harsh Notariya’s Daily Crypto Newsletter here.
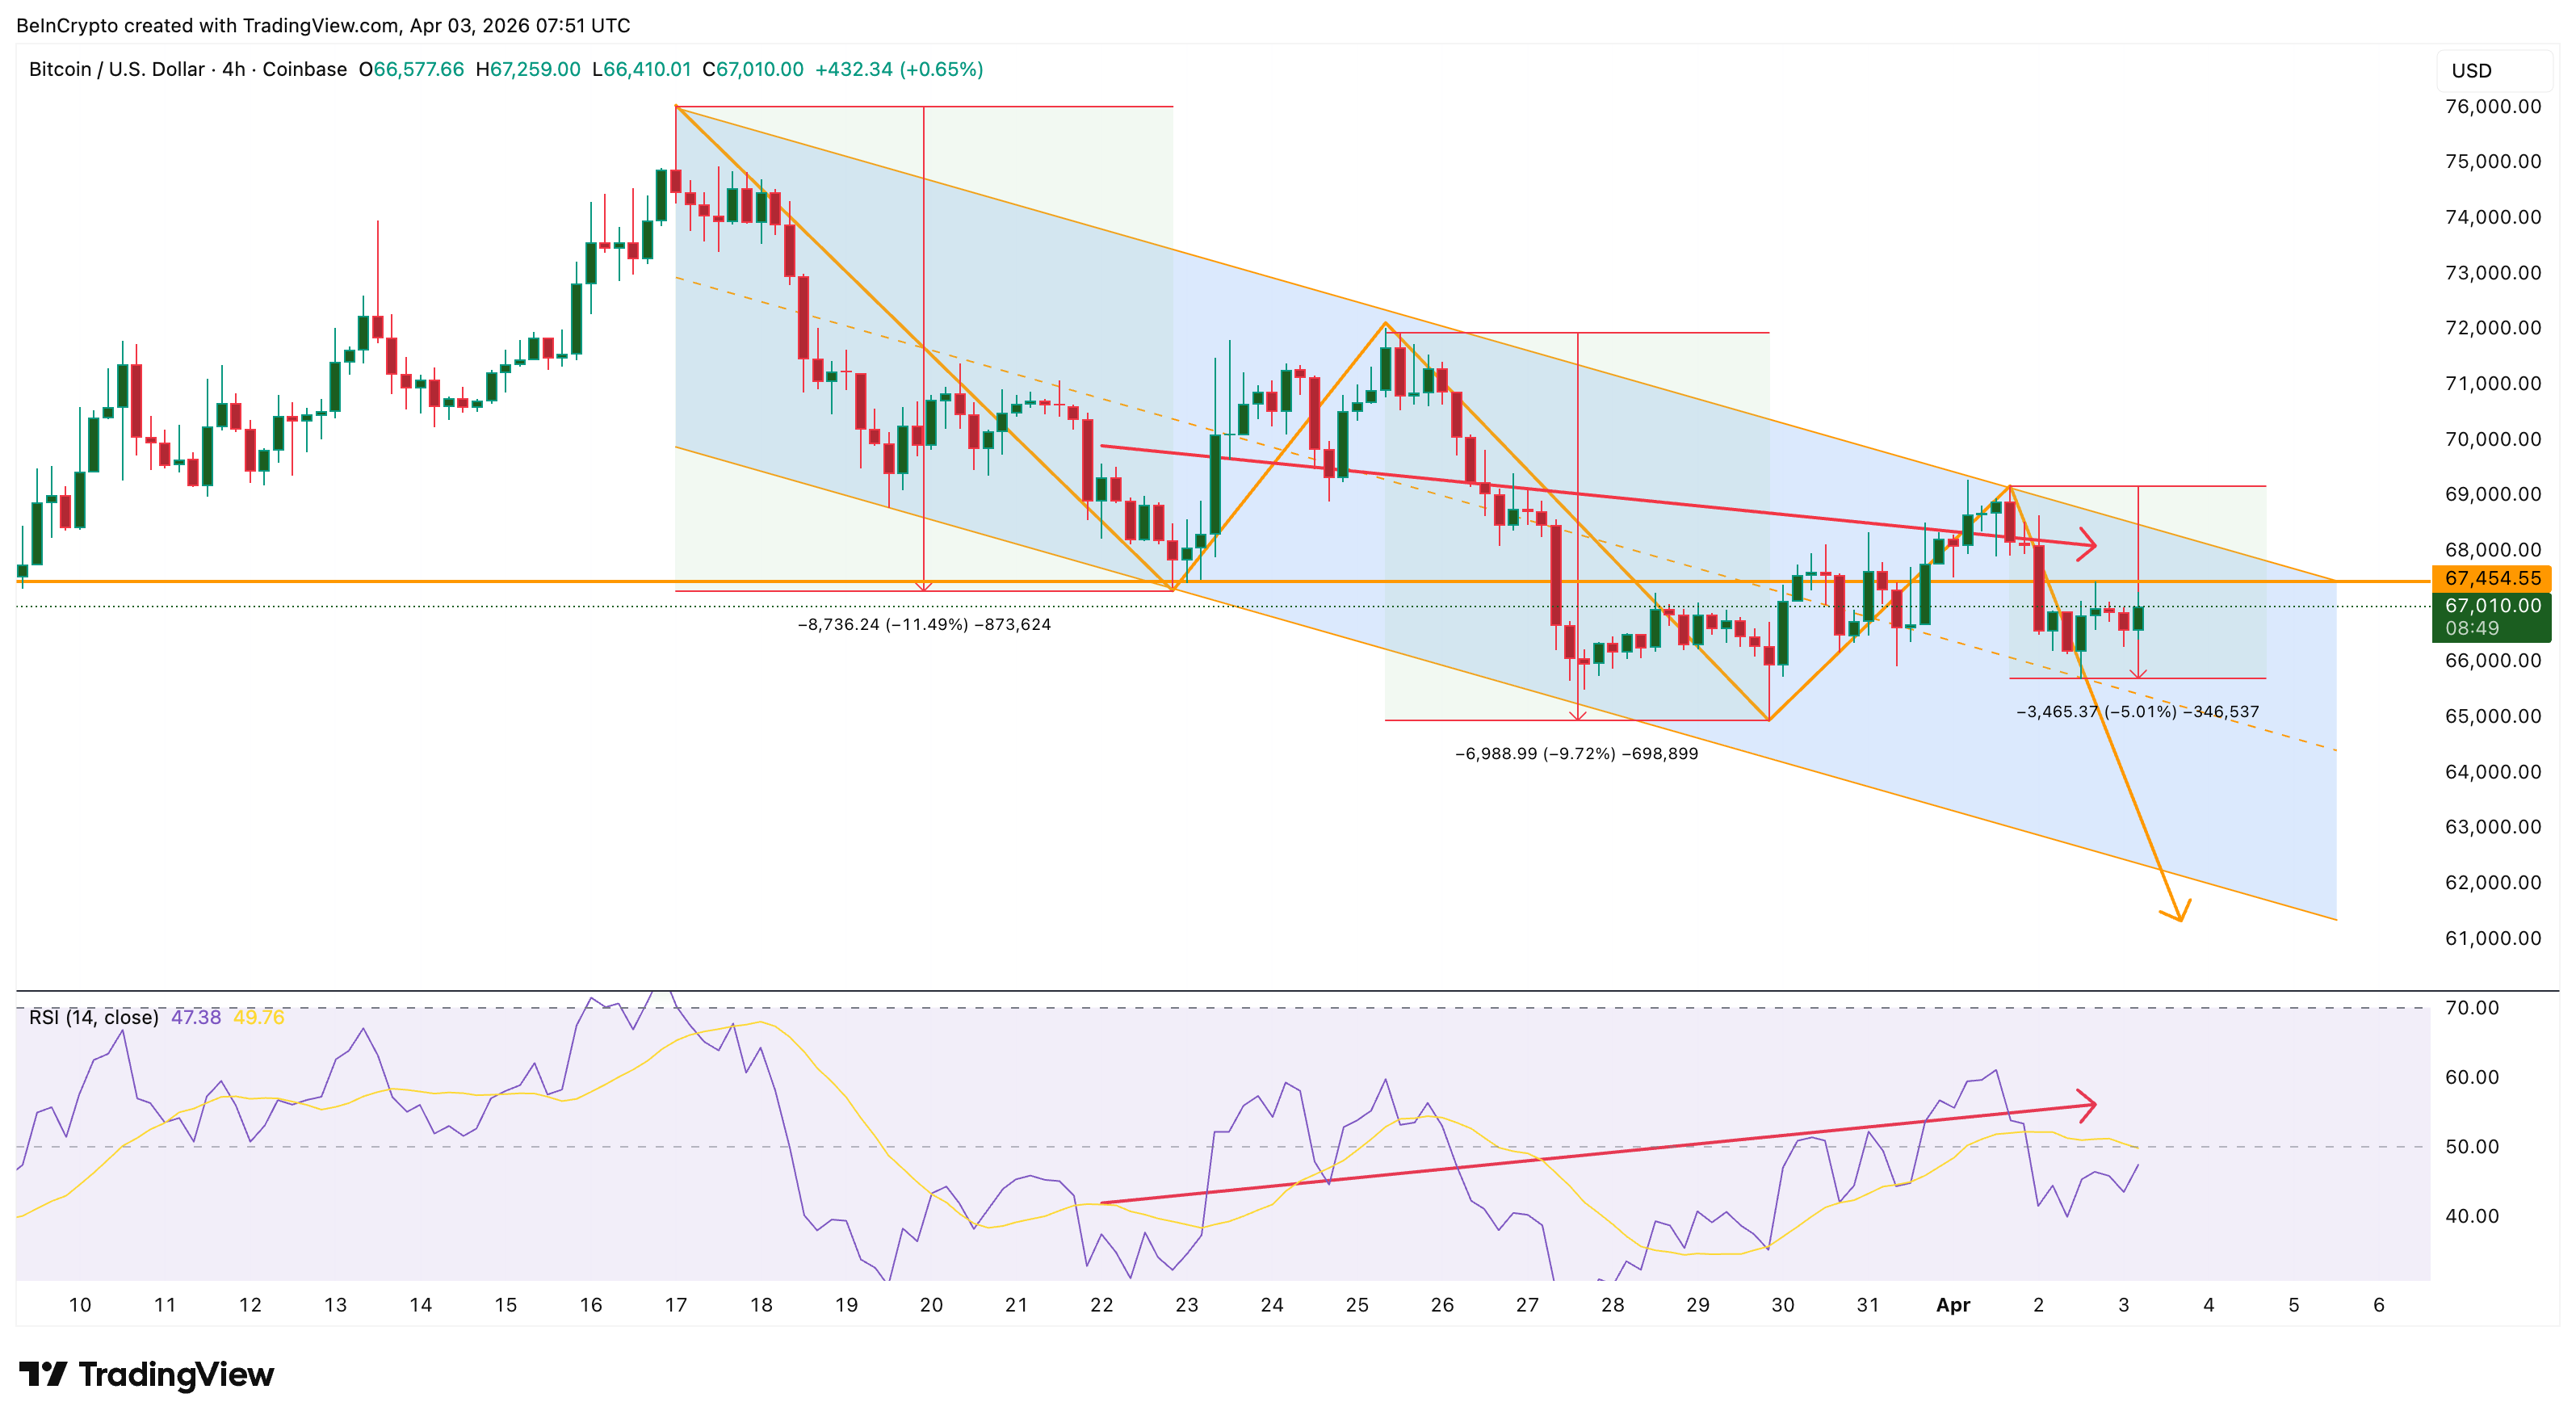 BTC Falling Channel Path: TradingView
The divergence would not get nullified unless Bitcoin price reclaims $67,454 on the 4-hour timeframe. With the current correction already confirmed by the divergence, the question becomes whether on-chain participants have reached exhaustion or still have losses left to give.
Short-Term Participants Have Not Hit Bottom Yet
The Short-Term Holder Net Unrealized Profit/Loss (STH-NUPL), a Glassnode metric that measures whether recent buyers are collectively in profit or loss, currently reads -0.22. This places short-term participants in the capitulation zone, meaning the average recent buyer is sitting on a 22% unrealized loss.
However, -0.22 is not deep capitulation by 2026 standards. The metric bottomed at -0.47 on February 5 during the sharpest sell-off of the year, nearly twice the current reading. The present level is comparable to early November 2025, a period that did not mark a durable floor. Short-term participants still have meaningful room to absorb additional pain before reaching the kind of extreme that historically signals exhaustion.
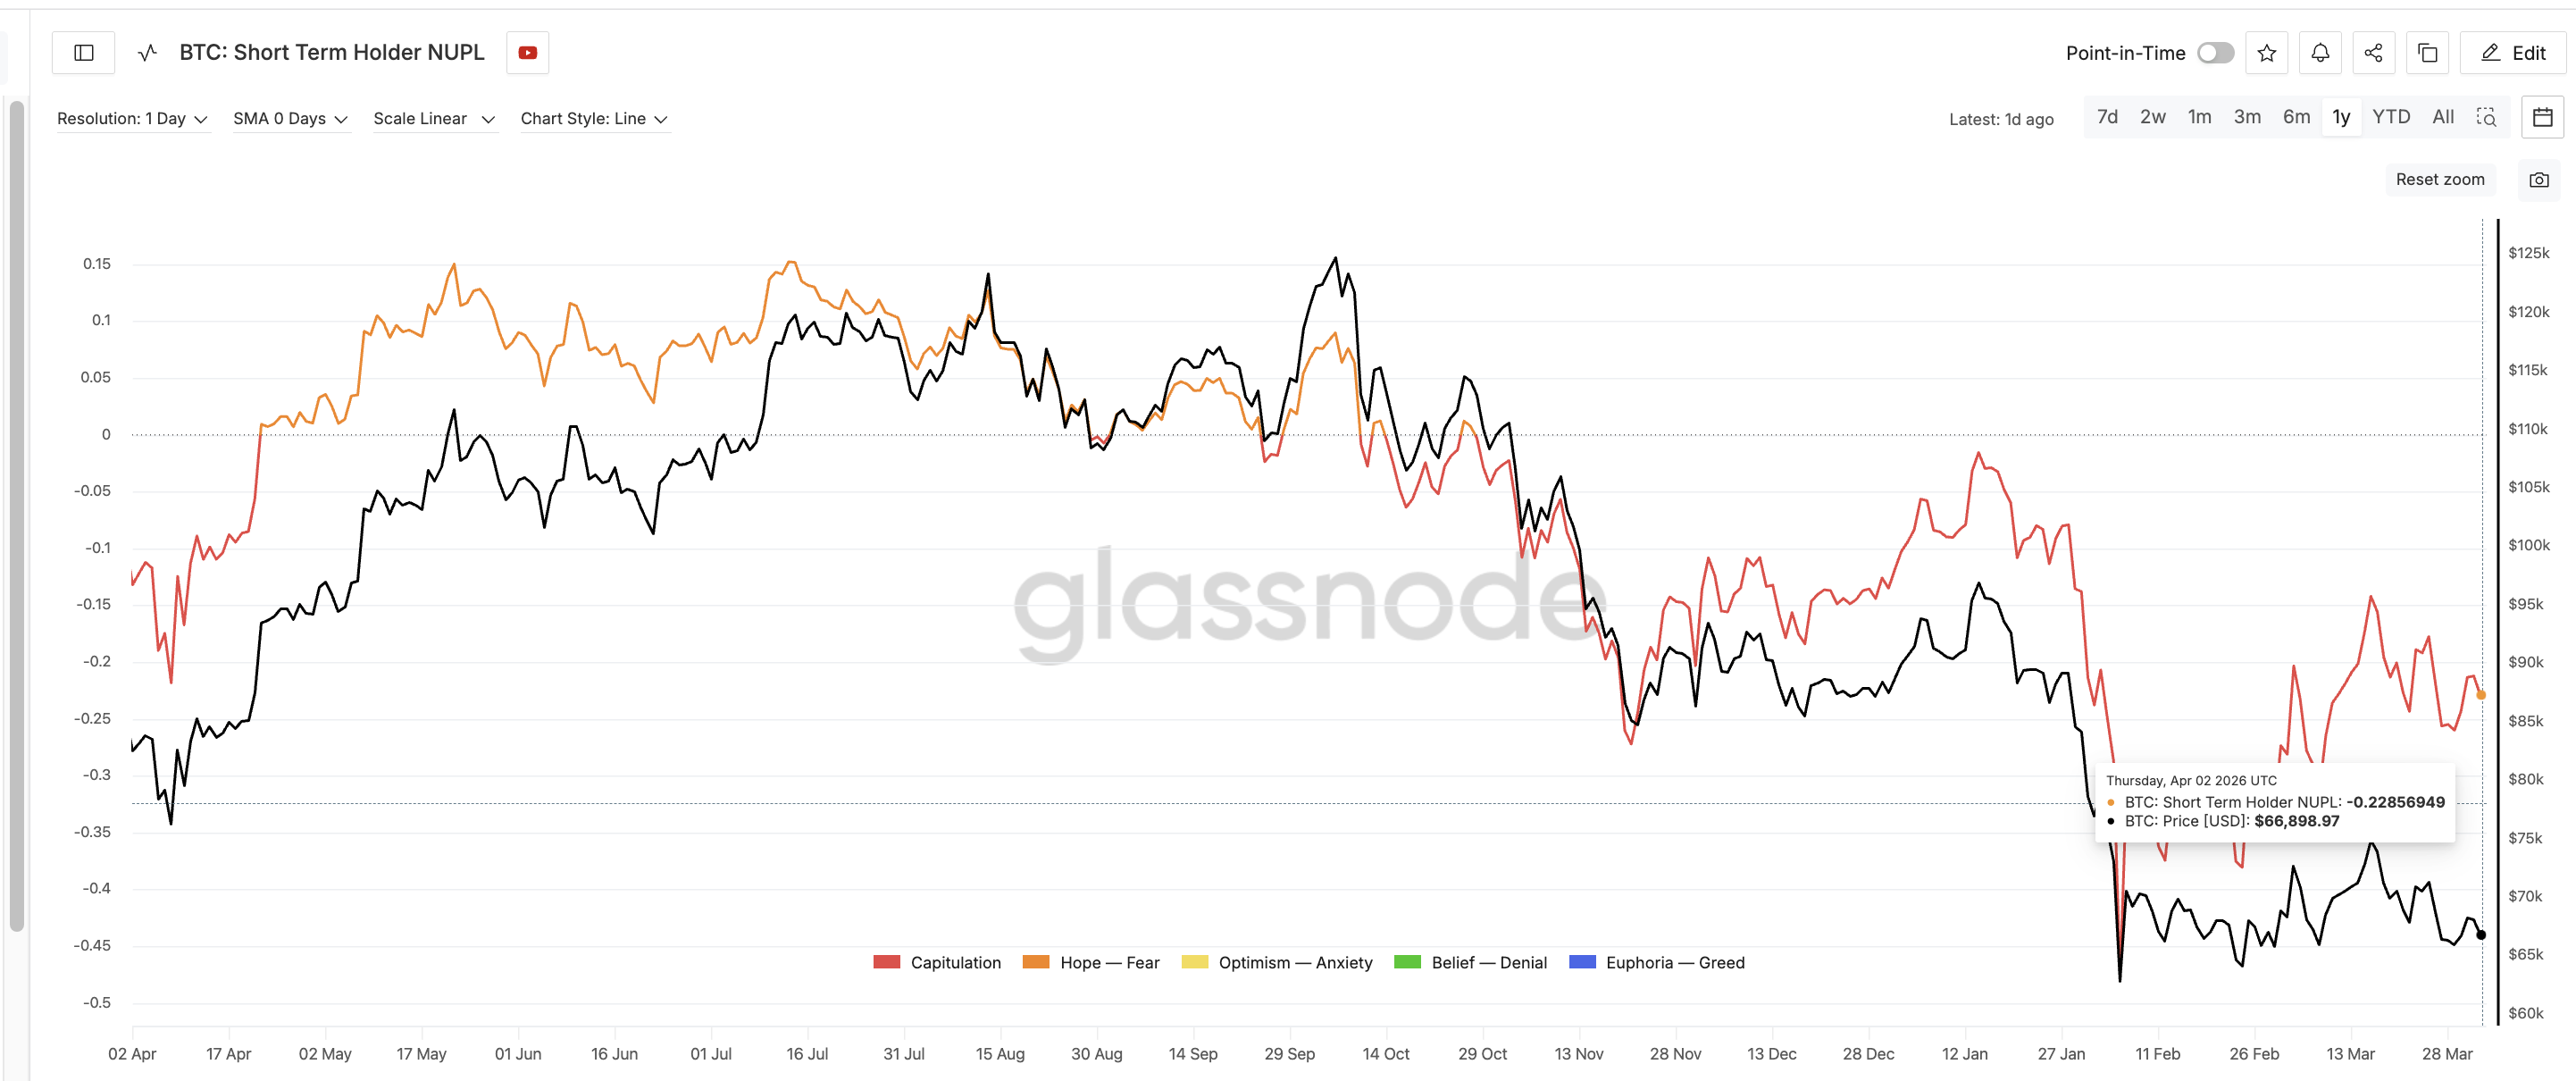 Short-Term Holder NUPL: Glassnode
The UTXO Realized Price Distribution (URPD), which highlights key supply clusters from Glassnode reveals exactly where that pain could materialize. The single largest near-term supply cluster sits at $65,636, where approximately 524,815 BTC representing 2.62% of the total supply last changed hands. A second cluster follows at $64,373 with 0.68% of supply.
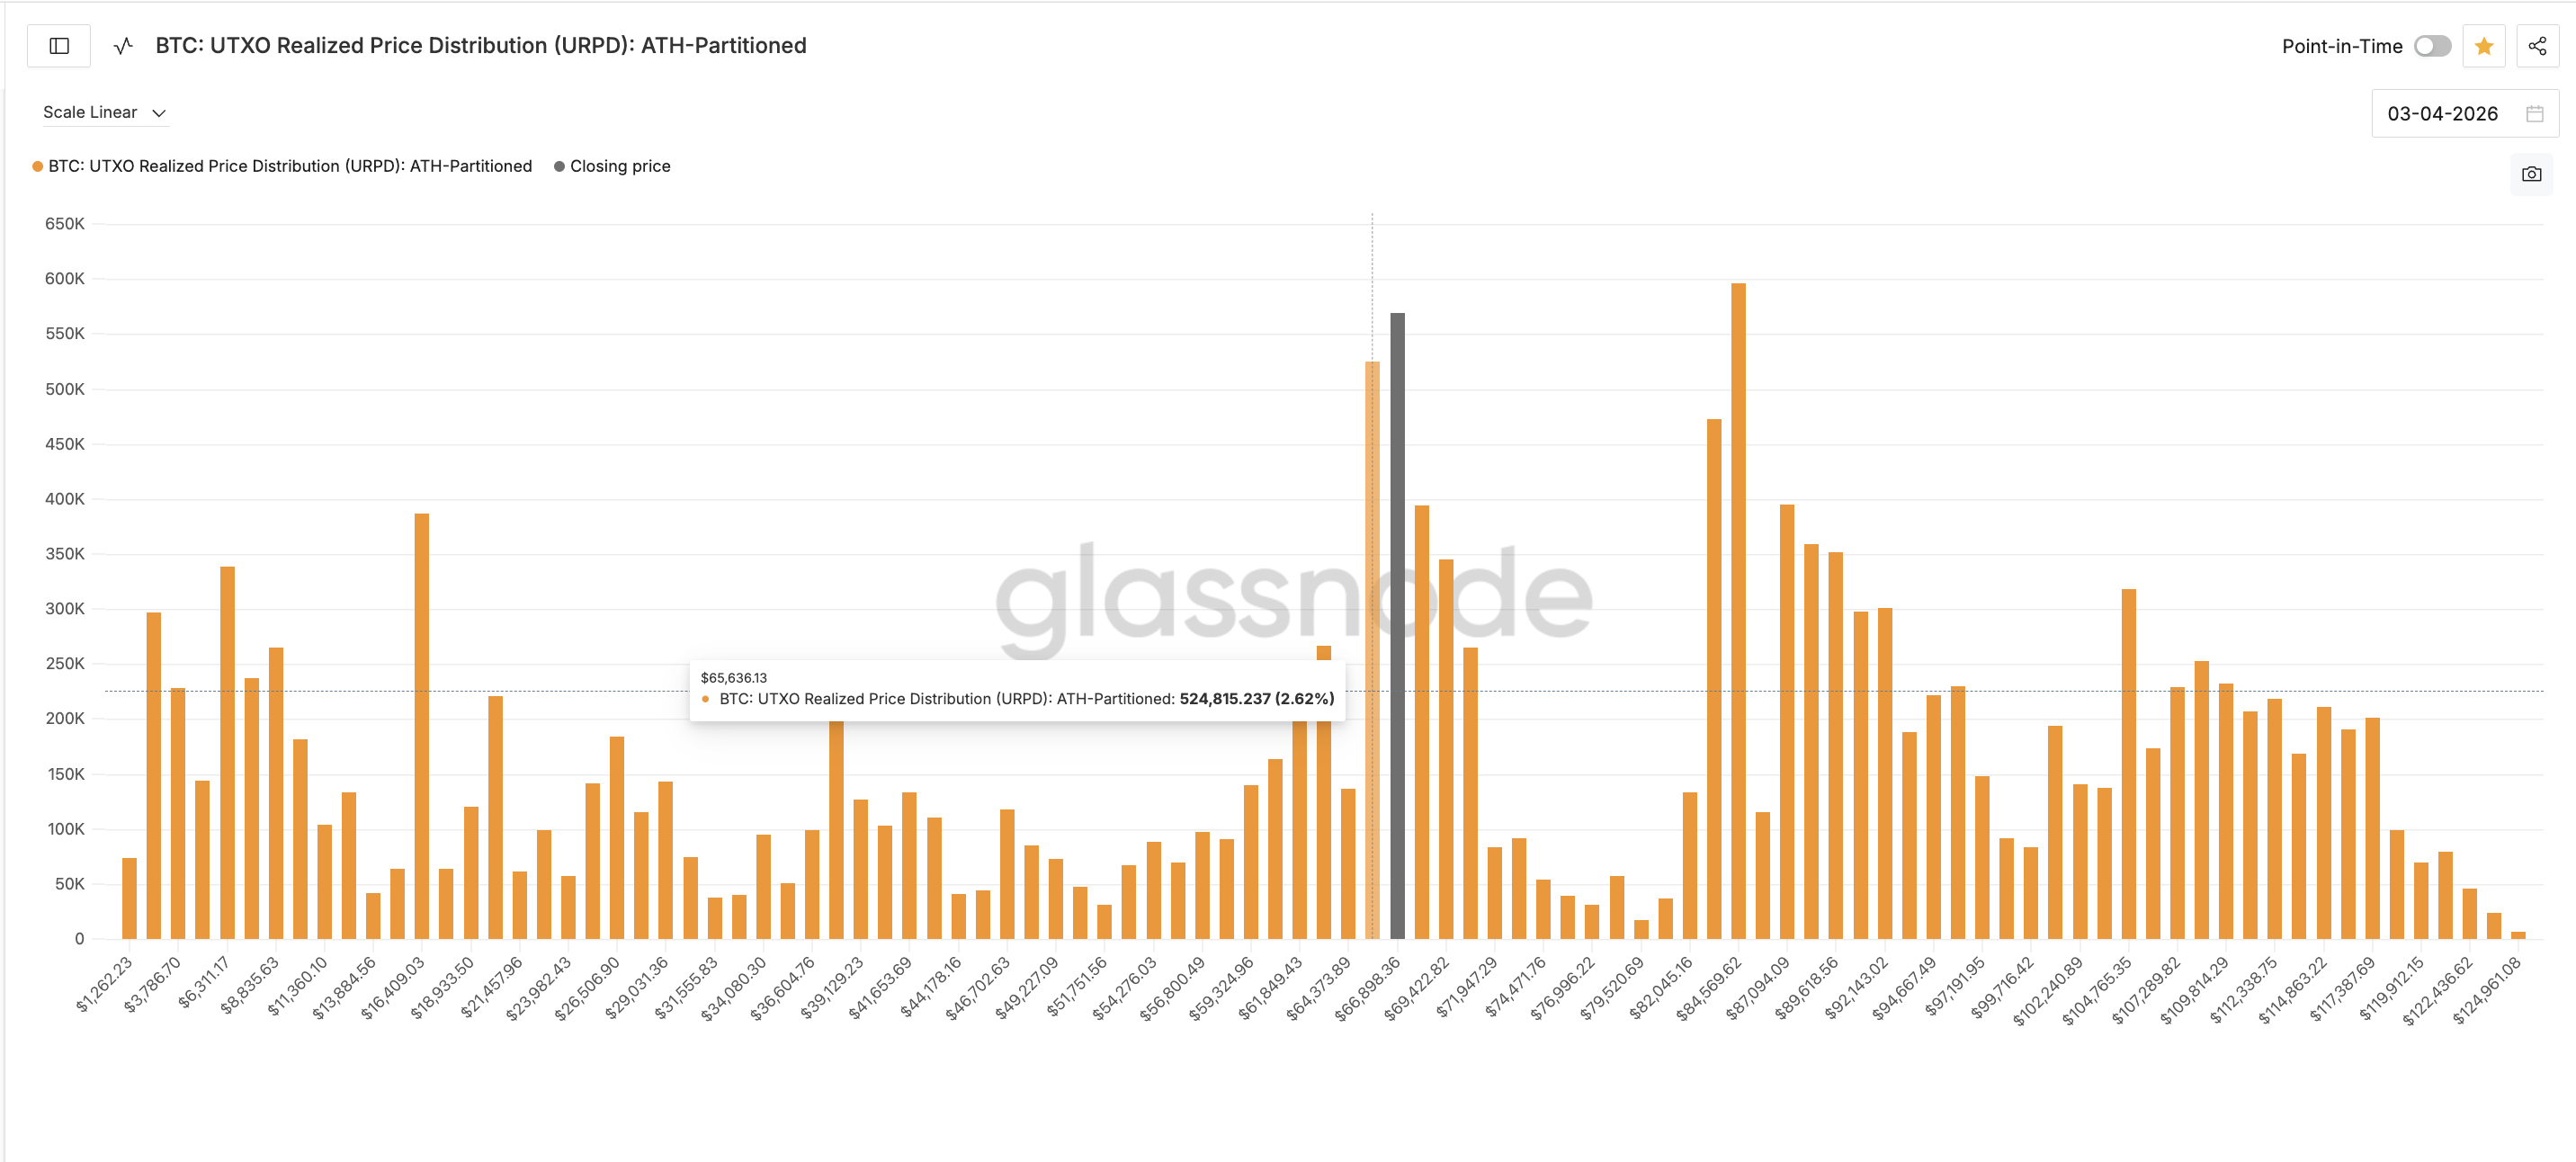 BTC URPD Supply Cluster: Glassnode
These clusters sit just 2-3% below the current price. If the third channel leg pushes Bitcoin price into this zone, the participants concentrated there face a decision. With STH-NUPL already in capitulation but far from its 2026 low, the probability that they sell rather than hold remains elevated. The price levels now determine whether the channel delivers them to that test.
Bitcoin Price and the 3% Gap to the Biggest Cluster
The 4-hour chart with Fibonacci levels frames every critical Bitcoin price level from here. BTC currently trades at $67,044, sitting between the 0.236 Fib at $67,607 and the 0.382 Fib at $66,580.
The first meaningful support however lies at $65,750, the 0.5 Fib. Below that, $64,920 at the 0.618 level offers key support. These two support zones align closely with the URPD clusters identified in the previous section. Losing $64,920 would mean the largest nearby supply concentration has been breached. If those participants choose to sell rather than absorb the loss, the path opens toward $63,737 and $62,232.
A drop to $62,232 would represent roughly 10% from the early April swing high. That’s consistent with the magnitude of the channel’s two completed drops. Below $62,232, $57,883 becomes the next structural target.
For the bearish thesis to fail, Bitcoin price needs a 4-hour close above $67,607, which would nullify the hidden bearish divergence. A close above $69,268, the level that has capped every attempt since early April, would confirm that the channel’s repeating pattern is breaking.
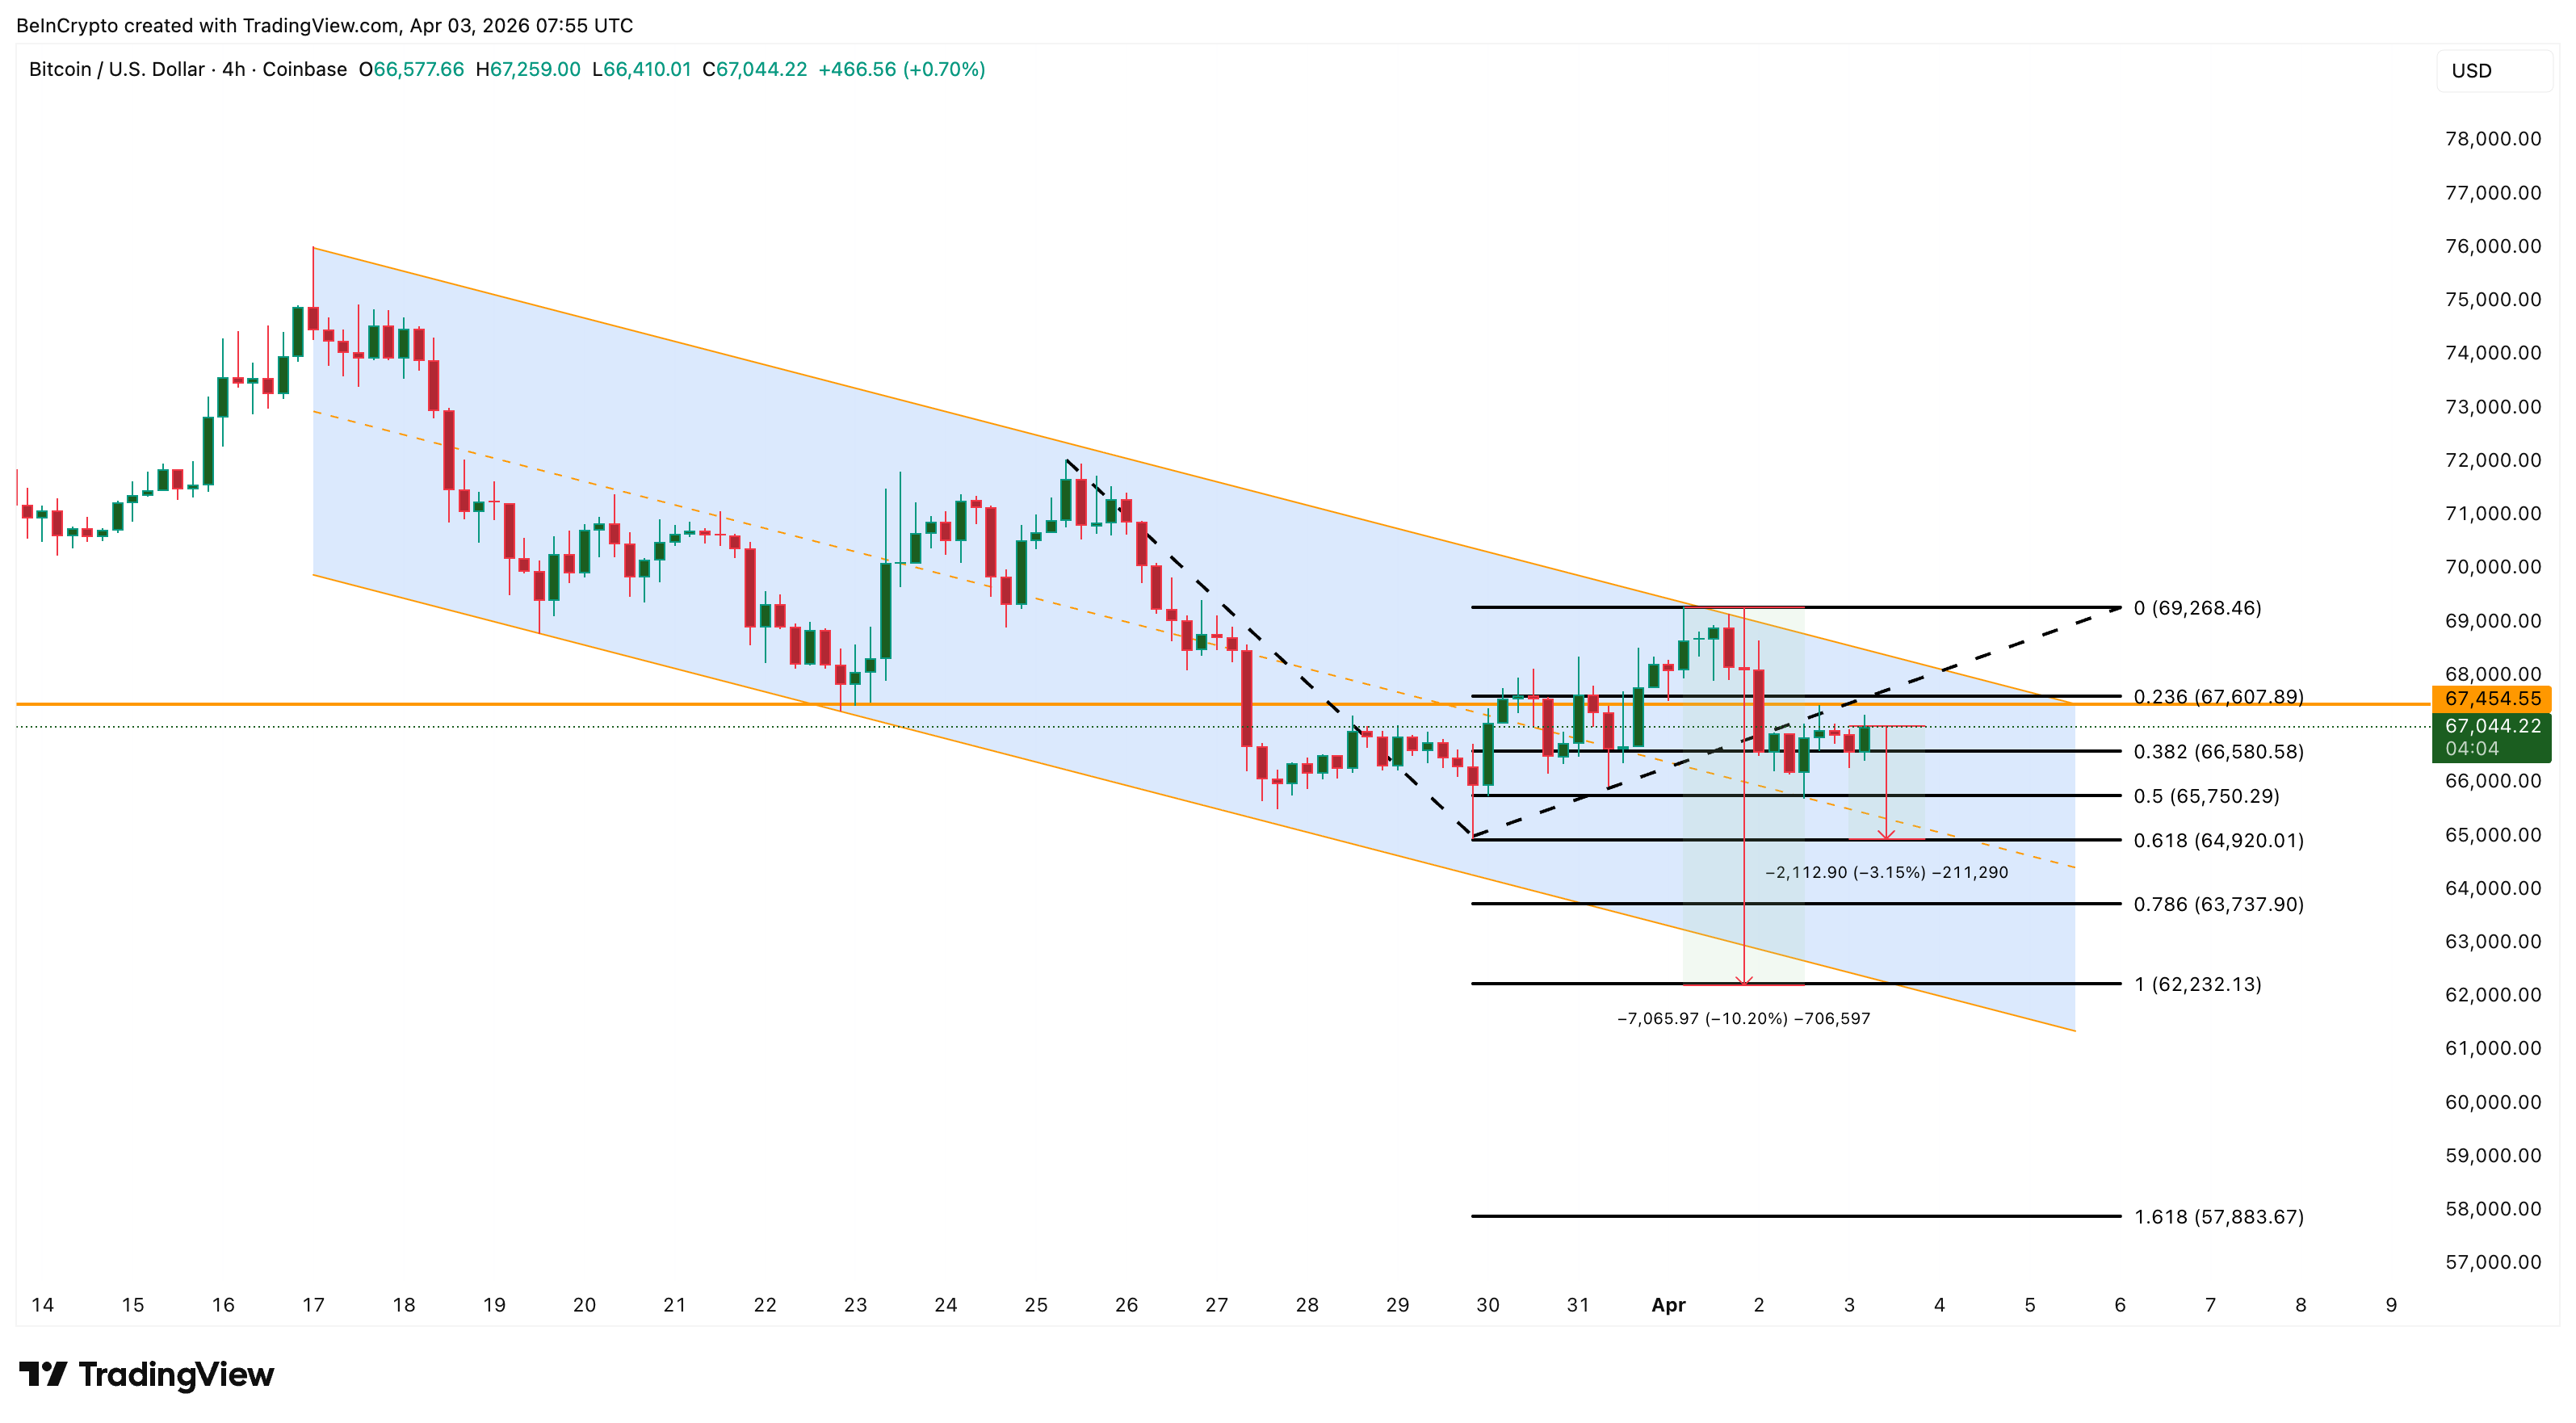 Bitcoin Price Analysis: TradingView
The channel has followed a repeating path twice. Whether the third leg matches the first two depends on whether the $65,636 supply cluster holds or folds. With STH-NUPL not yet at its 2026 low and hidden bearish divergence still active, the structure favors one more completed leg before exhaustion.
A 4-hour close below $64,920 separates a controlled pullback from a cluster-driven sell-off toward $62,232. However, reclaiming $67,607 would be the first step toward breaking the channel’s rhythm.
0
0


 Manage all your crypto, NFT and DeFi from one place
Securely connect the portfolio you’re using to start.


0
0

0
0