
Ethereum Price Prediction: ETH Eyes $2,200 Support or $3,000 Breakout

0
0

Ethereum is trading in the red today while Bitcoin, XRP, and Solana hold gains. ETH sits near $2,409, down about 0.53% on the day, as the broader crypto market digests a rough stretch for leveraged traders.
CoinGlass data shows 103,889 traders got liquidated in the past 24 hours. Total liquidations across the market hit $285.23 million.
For Ethereum specifically, the pain has been notable. Longs took the bigger hit as ETH cooled off from its recent highs.
What are the top crypto prices today?
Rank | Coin | Price | 1h | 24h | 7d |
1 | Bitcoin (BTC) | $77,912.58 | +0.26% | +0.41% | -1.15% |
2 | Ethereum (ETH) | $2,409.24 | +0.31% | -0.58% | -3.37% |
3 | Tether (USDT) | $0.9996 | +0.00% | -0.02% | -0.01% |
4 | BNB (BNB) | $698.12 | +0.45% | +1.41% | -1.07% |
5 | XRP (XRP) | $1.37 | +0.60% | +1.68% | -2.37% |
6 | USDC (USDC) | $0.9999 | +0.02% | +0.01% | -0.00% |
7 | Solana (SOL) | $101.09 | +0.46% | +0.91% | -0.16% |
Ethereum stands out as the only major coin among the top ranks showing red over the past 24 hours, even as Bitcoin, BNB, XRP, and Solana all posted gains.
How much did Ethereum liquidations total today?
Ethereum futures volume over the past 24 hours came in at $49.07 billion. Open interest remains high at $32.51 billion.
The Long/Short ratio sits around 0.98, which is close to balanced. But the liquidation split tells a different story.
Metric | Value |
ETH Price | $2,409.20 |
24h Change | -0.53% |
Futures Volume (24h) | $49.07B |
Open Interest | $32.51B |
Long/Short Ratio | 0.98 |
24h Long Liquidations | $38.06M |
24h Short Liquidations | $19.91M |
Total 24h Liquidations (ETH) | $57.97M |
Longs lost nearly double what shorts lost in the last day. That points to leveraged buyers getting caught off guard by the pullback from ETH's recent highs near $2,550.
Trader positioning on Binance also leans long. The Binance ETH/USDT account Long/Short ratio sits at 2.68, while top traders on the exchange show a slightly lower 1.60 ratio.
Over on OKX, the account Long/Short ratio reads 1.54. All three readings point to more accounts positioned long than short, even as Ethereum's price slips.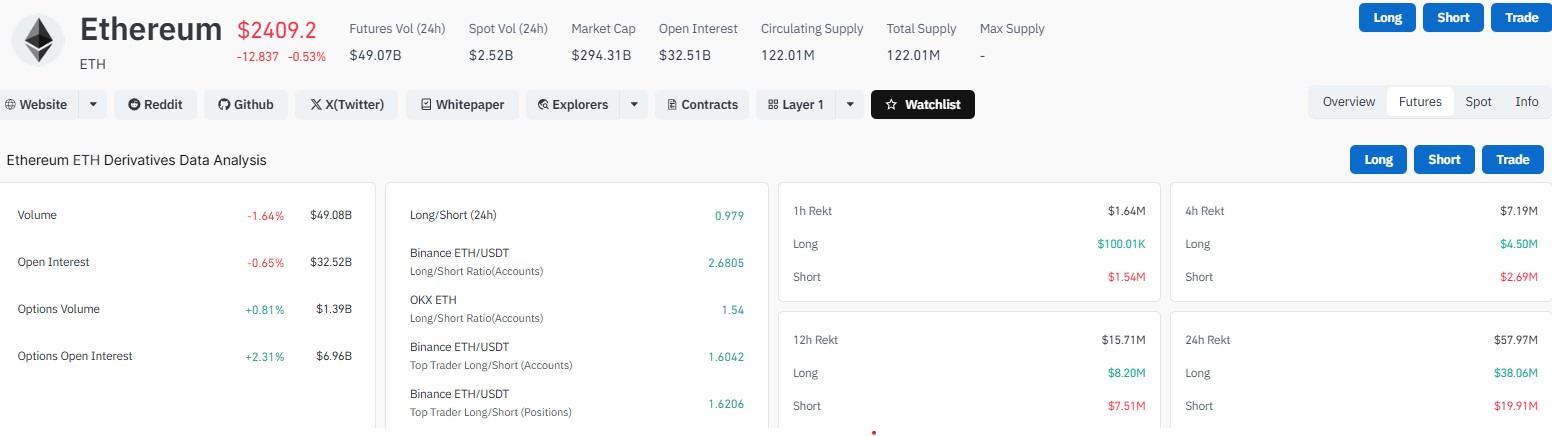
Did Ethereum ETFs see outflows this week?
Yes. After 12 straight days of inflows, $ETH spot ETFs recorded their first outflow in nearly two weeks.
On September 2, 2026, ETH ETFs saw a net outflow of $48.08 million, according to SoSoValue data. That breaks a streak that had pushed total net assets up sharply since late June.
Despite the outflow, total ETH ETF net assets still sit around $15.00 billion. Cumulative net inflow since launch remains at $13.03 billion.
One day of red doesn't erase weeks of steady institutional buying. But it does suggest demand may be cooling off after the run-up.
What is the Elliott Wave outlook for Ethereum?
Analyst Pepesso laid out a Wave 4 pullback scenario for Ethereum. The idea is that ETH just finished daily Wave 3 after a sharp impulse move higher.
That rally left behind what the analyst calls a downside imbalance, an area price may need to revisit. The primary Wave 4 target sits between $2,112 and $2,222.
Buyers could step in earlier, though. The 0.236 Fibonacci level near $2,324 is flagged as a spot where demand may show up before price reaches the deeper zone.
If that shallow bounce plays out, the next target box lands between $2,784 and $2,966, ahead of a possible deeper retrace toward the $2,100 floor later on.
There's a technical reason for expecting a shallow pullback rather than a deep one. Wave 2 earlier in this cycle was sharp and fast. Under Elliott Wave alternation, Wave 4 tends to look different, meaning flatter and more sideways.
A daily close below $2,050 would invalidate this Wave 4 structure altogether.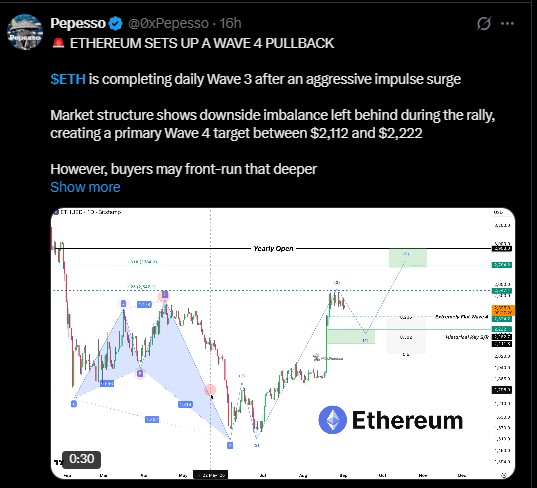
Where is Ethereum's key support and resistance right now?
On the daily chart, Ethereum has been trading inside a bullish flag pattern. Price keeps getting turned away from the $2,540 to $2,550 zone.
Support has been building around $2,380 to $2,350. ETH is still holding above its 20, 50, 100, and 200 EMAs, which is generally seen as a healthy sign for trend structure.
RSI sits near 63, showing momentum that's positive but not stretched into overbought territory.
A close above $2,550 would open the door to $2,700 through $2,900. From there, $3,000 becomes a realistic zone if buying pressure builds.
On the flip side, $2,325 is the level to watch. A break below that could send ETH toward $2,170, and potentially down to $2,060.
Could Ethereum price fall to $2,200?
The four-hour chart adds another layer. Ethereum has formed a rounded top pattern, which traders often read as a sign that momentum is fading after a strong move.
This particular pattern measures a height of 5.22%. Based on that measurement, ETH could slide toward $2,200 if it breaks below the $2,380 support.
The 4-hour RSI backs up this cooling picture, sitting near 42, well below the daily RSI of 63. That gap shows short-term momentum has weakened faster than the bigger trend.
Analyst Michael Van de Poppe shares a similar near-term view. He sees a drop to $2,200 as plausible and calls that level a good entry point for buyers looking to go long.
His longer-term outlook stays constructive. Van de Poppe suggests that a drop to $2,200 could set up a future recovery toward $3,000, if traders use the dip to build positions rather than sell into it.
The bigger picture for Ethereum right now
Ethereum is sitting at a crossroads. Short-term charts lean cautious, with a rounded top on the 4-hour timeframe and an ETF outflow breaking a long inflow streak.
Longer-term structure still looks intact. ETH holds above its major moving averages, and multiple analysts see $2,200 as a launchpad rather than a breakdown level.
Whether ETH grinds sideways in a Wave 4 consolidation or breaks down toward $2,050 will likely depend on how it handles the $2,325 to $2,380 support band over the coming days.
Disclaimer
This article is for informational purposes only and does not constitute financial, investment, or trading advice. Cryptocurrency markets are highly volatile and carry significant risk. Prices mentioned are subject to change. Always do your own research and consult a licensed financial advisor before making investment decisions.
0
0


 Manage all your crypto, NFT and DeFi from one place
Securely connect the portfolio you’re using to start.


