
$120M DeFi Allocation, Breakout or Rejection: Cardano Price Prediction

0
0

Cardano's community just approved 120 million ADA to supercharge DeFi growth on the network, and that headline alone has bulls excited again.
But this Cardano price prediction has to be honest about what the chart is actually showing: a trendline breakdown and a bearish EMA crossover that don't care about good news yet.
The bullish case needs a close back above $0.18570 in the next few days, while a break below $0.18064 would confirm sellers are still in control.
Market data was checked on August 14, 2026, at 12:58 IST.
Cardano Price Prediction Today: Market Overview
Metric | Value |
Price | $0.18190 |
24h Change | -2.0% |
Market Cap | $6.63B |
FDV | $8.17B |
24h Volume | $194.5M+ |
Vol/Mkt Cap (24h) | 2.92% |
Total Supply | 44.99B ADA |
Max Supply | 45B ADA |
Circulating Supply | 36.55B ADA |
Source: Data from CoinMarketCap as of August 14, 2026, at 12:58 IST. Figures may vary slightly across other tracking websites.
Cardano's $120M DeFi Allocation: What the Report Says
A post from the account BSCN reports that Cardano's community has approved 120 million ADA for AlphaGrowth's PRIME program.
AlphaGrowth is described as a DeFi growth and liquidity management firm, and the plan aims to deploy that capital across Cardano's DeFi ecosystem to lift total value locked above $200 million, up from roughly $68 million today. 
Source: Data From X
The revised proposal includes staggered fund releases, greater diversification, and a 24-month monitoring period and reportedly passed with 73.04% of participating voting stakes in favor.
AlphaGrowth also cut its proposed marketing budget from $2.4 million to $648,720 following community feedback.
Note: CoinGabbar could not independently verify these figures against Cardano's own governance portal, since the source here is a social media post rather than the original proposal record. These numbers should be treated as reported, not confirmed.
Cardano Price Prediction Chart: Technical Analysis
Pair: ADA/USD · Market: Spot (Crypto) · Timeframe: 4H · Source: TradingView · Timestamp: August 14, 2026, 12:58 UTC+5:30
ADA is trading at $0.18190, after breaking down from the ascending trendline it had held since late July.
The chart marks a clear trendline breakdown followed by a bearish EMA crossover, where the 20 EMA slipped below the 50 EMA, and the price has since drifted into a tight range just above the $0.18064 support level.
RSI (Relative Strength Index, a momentum reading that shows if an asset is overbought or oversold) sits at 36.31, leaning weak but not yet oversold, consistent with the recent slide.
EMA (Exponential Moving Average, a trend indicator that gives more weight to recent price action) 20 sits at $0.18523, and EMA 50 sits at $0.18800, both above the current price and acting as resistance; the recovery still needs to clear.
A break below the current support could open the door to the next downside level.
However, if the price holds this support and breaks above $0.2000, it could signal a potential trend reversal.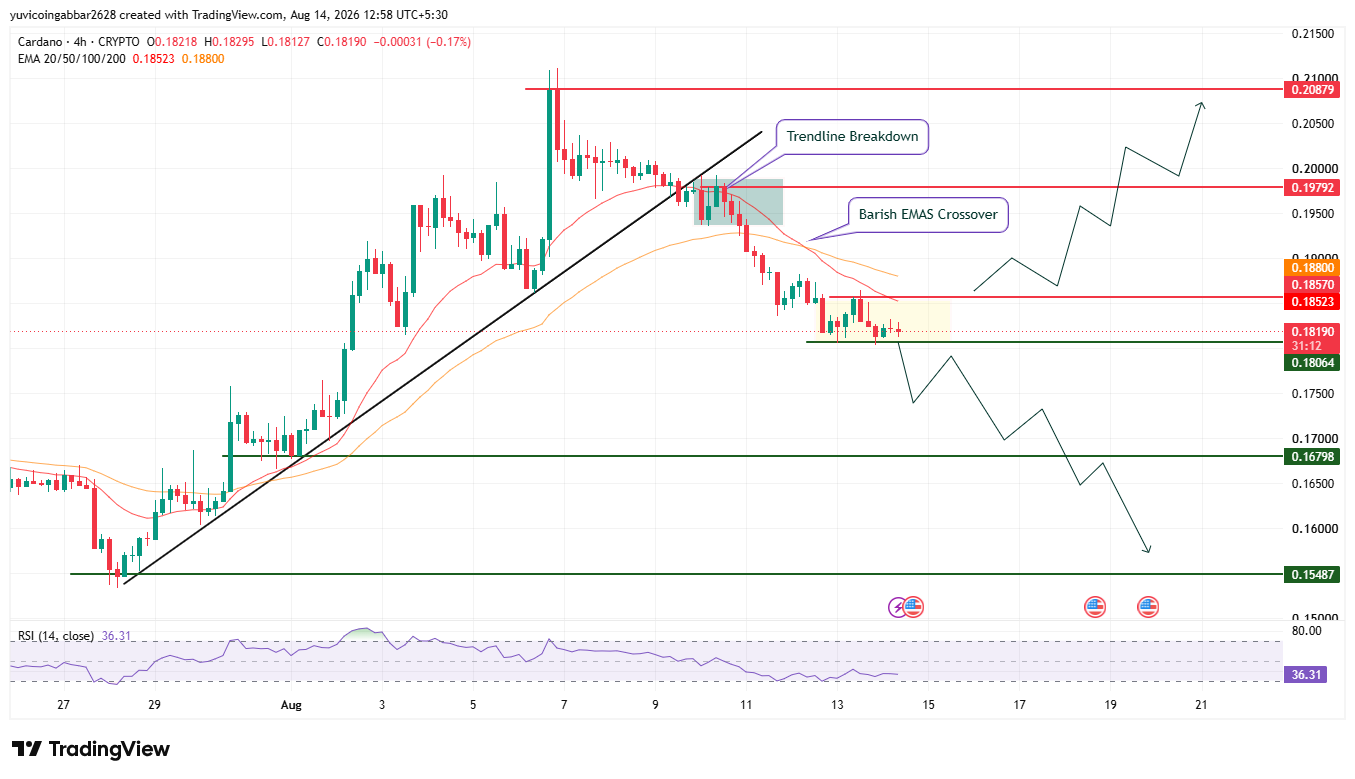
Support and Resistance Levels
Level Type | Price |
Resistance 3 | $0.20879 |
Resistance 2 | $0.19792 |
Resistance 1 (nearest) | $0.18570 |
Immediate Price Reference | $0.18190 |
First Support | $0.18064 |
Deeper Support | $0.16798 |
Structural Floor | $0.15487 |
EMA Levels
EMA | Price |
EMA 20 | $0.18523 |
EMA 50 | $0.18800 |
Cardano Price Prediction: Bull Case vs. Bear Case
ADA price target 2026 Bull case: Holding above $0.18064 and reclaiming both EMAs near $0.18523 to $0.18800 would suggest the breakdown is losing steam.
A confirmed close above $0.18570 would open the path toward $0.19792, and the DeFi allocation news could add extra sentiment if TVL actually starts climbing.
ADA price target 2026 Bear case: A break below $0.18064 would confirm the trendline breakdown has real follow-through, regardless of the DeFi headline.
Losing $0.16798 would expose $0.15487 as the next downside level.
ADA Price Scenarios: Triggers and Invalidation
Scenario | Trigger | Likely Outcome | Invalidation Point |
Trendline reclaim | Close above $0.18570 and above both EMAs | Move toward $0.19792, then $0.20879 | Rejection back below $0.18570 |
Channel hold | Price stays between $0.18064 and $0.18570 | Choppy, range-bound trading | Break of either boundary |
Channel breakdown | Close below $0.18064 | Move toward $0.16798, then $0.15487 | Reclaim of $0.18064 |
ADA price target: Can ADA Reach $0.20879?
$0.20879 is the highest resistance level marked on the chart.
Reaching it would require ADA to first reclaim $0.18064 as a base, clear both EMAs near $0.18523 and $0.18800, then break and hold above $0.19792, a multi-stage move rather than a single leg.
What Could Invalidate the Bullish Setup?
A rejection at the EMA zone or $0.18570 followed by a close back below $0.18064 would confirm the breakdown is still in control.
A deeper break below $0.16798 and eventually $0.15487 would undermine the bullish case entirely, no matter how the DeFi allocation news develops.
Cardano Price Prediction: Expert View
According to CoinGabbar analysts, the trendline breakdown and bearish EMA crossover are still the dominant technical story here, and the $120M DeFi allocation hasn't shown up as buying pressure on the chart yet.
RSI at 36.31 leaves room for a bounce without being oversold.
The $0.18064 to $0.18570 zone is the real battleground: holding it keeps a recovery case alive, while losing it confirms sellers remain in charge.
Disclaimer: This piece is for informational purposes only and isn't financial advice. The levels and scenarios above are based on technical chart analysis and publicly available data at the time of writing, and crypto markets can move sharply within hours, so past patterns don't guarantee future outcomes. It's worth doing independent research and considering your own risk tolerance before acting on any of the levels discussed here.
0
0

 Manage all your crypto, NFT and DeFi from one place
Securely connect the portfolio you’re using to start.


0
0

0
0

0
0