
Dogecoin Price Prediction: The One Move That Could Change DOGE Forever

0
0

DOGE just went through a rough stretch, and the charts are showing exactly how rough.
This dogecoin price prediction looks at the next one to seven trading days using the daily and 4-hour charts, recent liquidation data, and exchange volume, not a long-range call.
The short version: does this support zone hold, or does Dogecoin have one more leg down before it can turn things around?
A Quick Look Back at Dogecoin
Dogecoin launched in 2013 as a joke and became one of the most recognized names in crypto anyway.
Unlike most large-cap coins, DOGE has no fixed maximum supply and no vesting or unlock schedule to worry about; new coins enter circulation at a steady, predictable rate through mining, roughly 5 billion DOGE a year.
That's a genuinely different risk profile from tokens facing large scheduled unlocks, and it's worth knowing before comparing DOGE's setup to something like an L1 or DeFi token.
Price-wise, DOGE is still trading well below its May 2021 all-time high near $0.74, and like most of the memecoin sector, it has been through repeated 70%+ drawdowns followed by sharp recoveries.
That history doesn't predict what happens next, but it's useful context for how this current dip fits into DOGE's longer pattern.
Where DOGE Sits Right Now
As of the timeframe covered in this analysis, DOGE is trading around $0.0715, down over 1% on the day after dipping as low as $0.0712.
That puts it inside a support cluster that both the daily and 4-hour charts flag as the level to watch. Chart levels below are accurate as of publication.
If the price moves meaningfully past either boundary mentioned in this article, treat the specific numbers as needing a refresh rather than still current.
Liquidation Data Shows a Sharp Squeeze on Longs
According to Coinglass liquidation data, DOGE saw a heavy, one-sided liquidation event recently, concentrated almost entirely on long positions.
Over the past 24 hours, DOGE recorded $3.64M in total liquidations, with $3.11M of that coming from longs and $534.82K from shorts.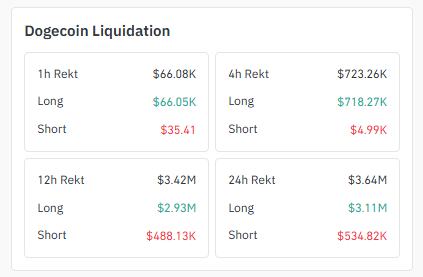
The shorter windows show the same imbalance. In the last hour, $66.08K was liquidated, with $66.05K of that being longs.
Over 4 hours, $723.26K total, with $718.27K from longs alone. Over 12 hours, $3.42M in liquidations, with $2.93M from long positions.
A flush of this lopsided usually means a large share of over-leveraged bulls have already been forced out, which, though it doesn't always, can set up cleaner price action once the forced selling is done.
Exchange Volume Heatmap: Binance Carries the Bulk of Volume
Binance accounts for the largest share of DOGE futures volume at $246.78M, ahead of OKX at $158.37M.
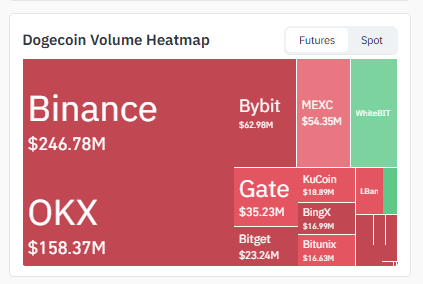
Bybit ($62.98M) and MEXC ($54.35M) form the next tier, followed by Gate ($35.23M), Bitget ($23.24M), KuCoin ($18.89M), BingX ($16.99M), and Bitunix ($16.63M), with WhiteBIT and LBank carrying smaller amounts.
Because Binance carries such a large share of total volume, price behavior there during this support test is likely to have an outsized influence on where DOGE goes next.
How DOGE's Setup Compares to Other Large-Cap Memecoins
| Coin | Current Structure | Key Support Being Tested | Notable Difference |
|---|---|---|---|
| DOGE | Fib retracement + descending trendline | $0.06955 (100% retracement) | No token unlocks; fixed annual issuance |
| SHIB | Descending channel | Mid-channel support | Deflationary via burns, no fixed supply cap |
| PEPE | Range-bound consolidation | Prior demand zone | Fully diluted at launch, no ongoing issuance |
This isn't a call on which coin performs better; it's meant to show that "memecoin" isn't one uniform risk profile.
Supply mechanics differ meaningfully between these three, even when their charts look similar.
4-Hour Chart: Support Holding, For Now
On the 4-hour chart, DOGE is trading near $0.07163, sitting on a support zone at $0.07115.
This level has already been tested once and held, though the bounce off it hasn't been convincing yet.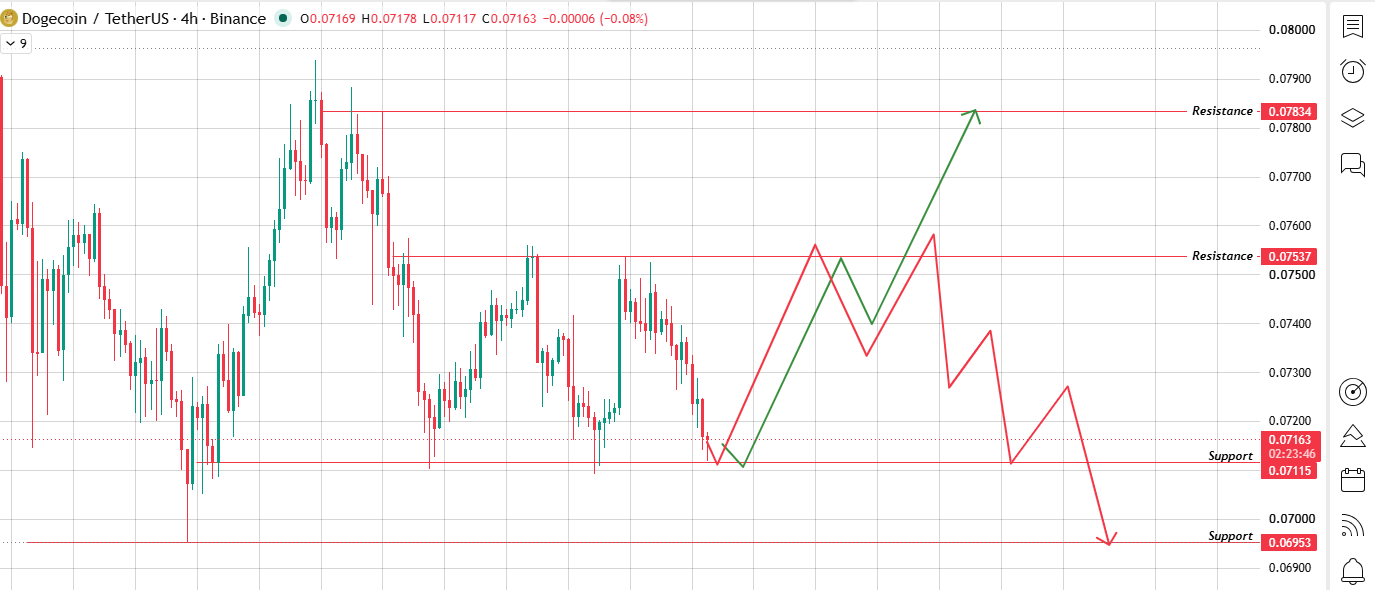
If buyers step in here, the first resistance to clear is $0.07537, a level that's already rejected one attempt. A confirmed break above that opens the path to $0.07834.
If this support cracks instead, the next level down is $0.06953, which lines up closely with the daily chart's 100% retracement support. Both timeframes are pointing at the same line in the sand.
Short-Term Support & Resistance (4H)
| Level | Price | Importance |
|---|---|---|
| Resistance 1 | $0.07537 | Key intraday resistance |
| Resistance 2 | $0.07834 | Extended bullish target |
| Support 1 | $0.07115 | Immediate support, currently being tested |
| Support 2 | $0.06953 | Bearish breakdown target |
Daily Chart: Price Testing a Critical Fibonacci Zone
On the daily chart, DOGE has pulled back into a Fibonacci retracement zone a set of horizontal levels (38.2%, 61.8%, 78.6%, 100%, and beyond) that traders use to estimate where a pullback might find support after a prior move.
DOGE is currently sitting near the 78.6% retracement around $0.07174, just above the deeper 100% retracement at $0.06955.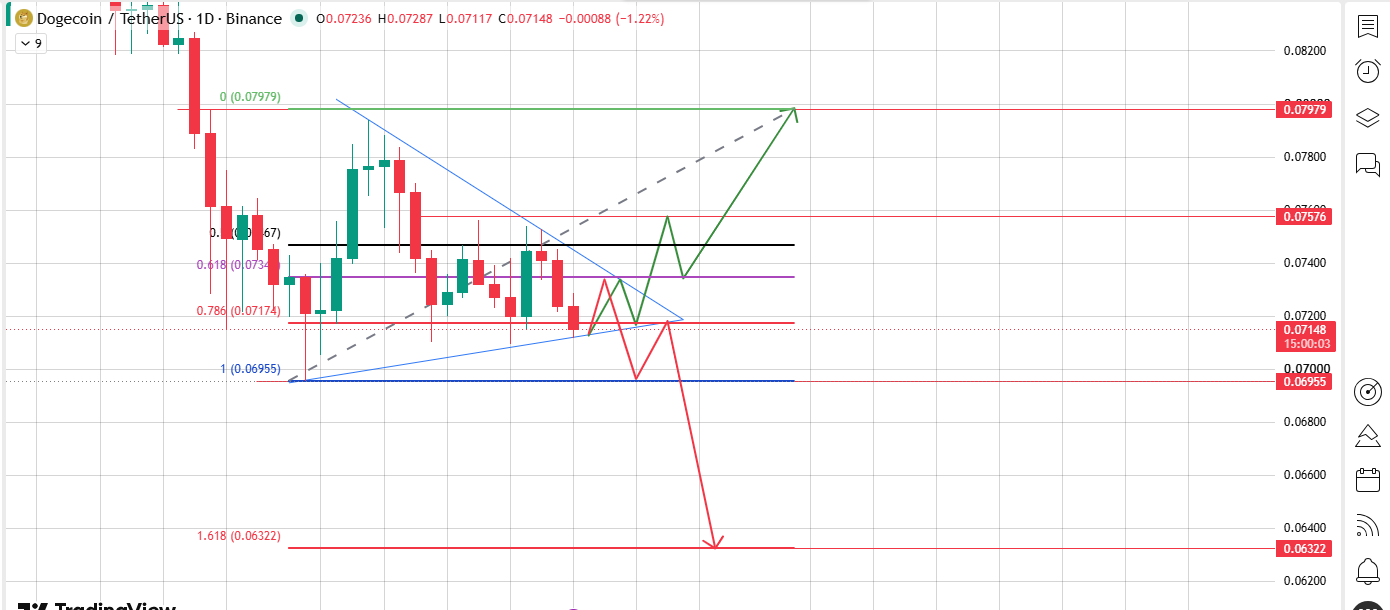
Price has also been grinding along a descending trendline that's capped every bounce so far, while a rising support trendline from below is starting to converge with it.
If DOGE holds this zone and reclaims the trendline, the first target above is $0.07576. A confirmed close above that could open the path toward $0.07979, which lines up with the recent swing high.
If support gives way instead, $0.06955 becomes the critical level. DOGE has respected this 100% retracement before.
A clean daily close below it would open the door to the $0.06322 extension target (the 161.8% Fibonacci extension), a meaningfully deeper flush than what's already happened.
Long-Term Support & Resistance (Daily)
| Level | Price | Importance |
|---|---|---|
| Major Resistance 1 | $0.07576 | Key resistance from prior structure |
| Major Resistance 2 | $0.07979 | Recent swing high, major bullish target |
| Major Support 1 | $0.06955 | 100% Fibonacci retracement, critical support |
| Major Support 2 | $0.06322 | 161.8% Fibonacci extension, bearish target |
What Would Invalidate This Setup
This analysis is a short-term technical read, not a certainty, and it can be wrong quickly in either direction. A few specific risks worth flagging:
False breakout risk: A brief wick above $0.07537 or below $0.07115 doesn't confirm anything on its own this setup relies on a full 4H or daily candle close beyond those levels, not just an intraday touch.
Volatility risk: DOGE is a high-beta, sentiment-driven asset. A sudden Bitcoin move, a macro headline, or a large single-wallet transfer can override the technical picture entirely within hours.
Liquidity-driven wicks: Given the scale of recent liquidations (below), sharp wicks through either level are possible without representing a genuine trend change; they can just be forced closures of leveraged positions.
Time sensitivity: These levels reflect a specific snapshot in time. If several days pass without a resolution either way, revisit the chart rather than relying on the numbers in this piece.
Social Sentiment: A Familiar Argument Resurfaces on X
A recurring argument is circulating on X right now, and DOGE is part of it.
According to Trader Drallio , large established memecoins have historically gone through sharp pullbacks like this one, citing both DOGE and PEPE. 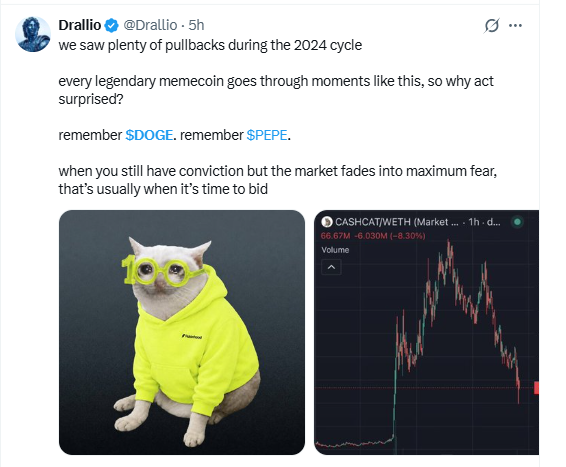
As past examples show, and argued that periods of high conviction paired with elevated fear have often preceded rebounds.
This is one trader's opinion, not a data-backed indicator, and past pullback then recovery patterns don't guarantee a repeat. It's included here as a sentiment data point, not as validation of the technical setup above.
Treat it with the same caution as any single social media source.
DOGE Price Scenarios: Bullish, Neutral, Bearish
| Scenario | Trigger | Price Targets |
|---|---|---|
| Bullish Breakout | Daily reclaim of $0.07576 or 4H close above $0.07537. | $0.07834 → $0.07979 |
| Neutral / Range-Bound | Price stays between $0.06955 and $0.07537. | Continued chop near current levels |
| Bearish Breakdown | Daily loss of $0.06955 or 4H loses $0.07115 support. | $0.06953 → $0.06322 |
Glossary
Liquidation: The forced closing of a leveraged position when losses eat through the trader's margin.
Fibonacci retracement: A set of horizontal levels (like 61.8%, 78.6%, 100%) used to estimate where a price pullback may pause or reverse after a prior move.
Trendline: A line connecting a series of price highs or lows, used to visualize the direction and slope of a trend.
Breakout / breakdown: A confirmed close beyond a resistance (breakout) or support (breakdown) level, signaling a potential continuation in that direction.
Final Outlook: DOGE Needs Bitcoin to Cooperate
DOGE tends to track overall market risk appetite more closely than most large-cap coins, so Bitcoin's near-term direction matters here.
If BTC stabilizes and broader sentiment improves, that backdrop could help DOGE hold this support zone and work toward $0.0758 and then $0.0798.
If Bitcoin weakens or fear stays elevated, DOGE's support cluster is more likely to break, opening a path toward the $0.0695–$0.0632 zone.
DOGE is sitting right at the level that decides which of these plays out.
Given the scale of the recent long liquidations, the next few sessions should clarify the direction, but as with any short-term technical setup, this should inform position sizing and risk management, not replace it.
Disclaimer: This article is for informational purposes only and should not be considered financial advice. Cryptocurrency markets are highly volatile; always do your own research before making investment decisions.
0
0

 Manage all your crypto, NFT and DeFi from one place
Securely connect the portfolio you’re using to start.

0
0

0
0

0
0
