HBAR Selling Pressure at its Highest in 2026, Will Long Traders Face Liquidation

0
0
Hedera price continues to trend lower as sustained selling pressure weighs on market structure. HBAR has remained locked in a prolonged downtrend, limiting recovery attempts.
Recent data shows sellers firmly in control, pushing HBAR toward critical support zones as confidence weakens among short-term and leveraged traders.
Hedera Holders Sell
Market sentiment around HBAR remains decisively bearish. The Money Flow Index indicates persistent selling pressure across recent sessions.
The indicator has dropped below the neutral 50.0 threshold and now sits in negative territory, signaling capital outflows dominating inflows.
This reading suggests investors remain skeptical about a near-term recovery.
Furthermore, when MFI stays suppressed, it reflects declining demand and reduced risk appetite. Such conditions often precede continued price weakness, especially when momentum fails to shift back toward accumulation.
Want more token insights like this? Sign up for Editor Harsh Notariya’s Daily Crypto Newsletter here.
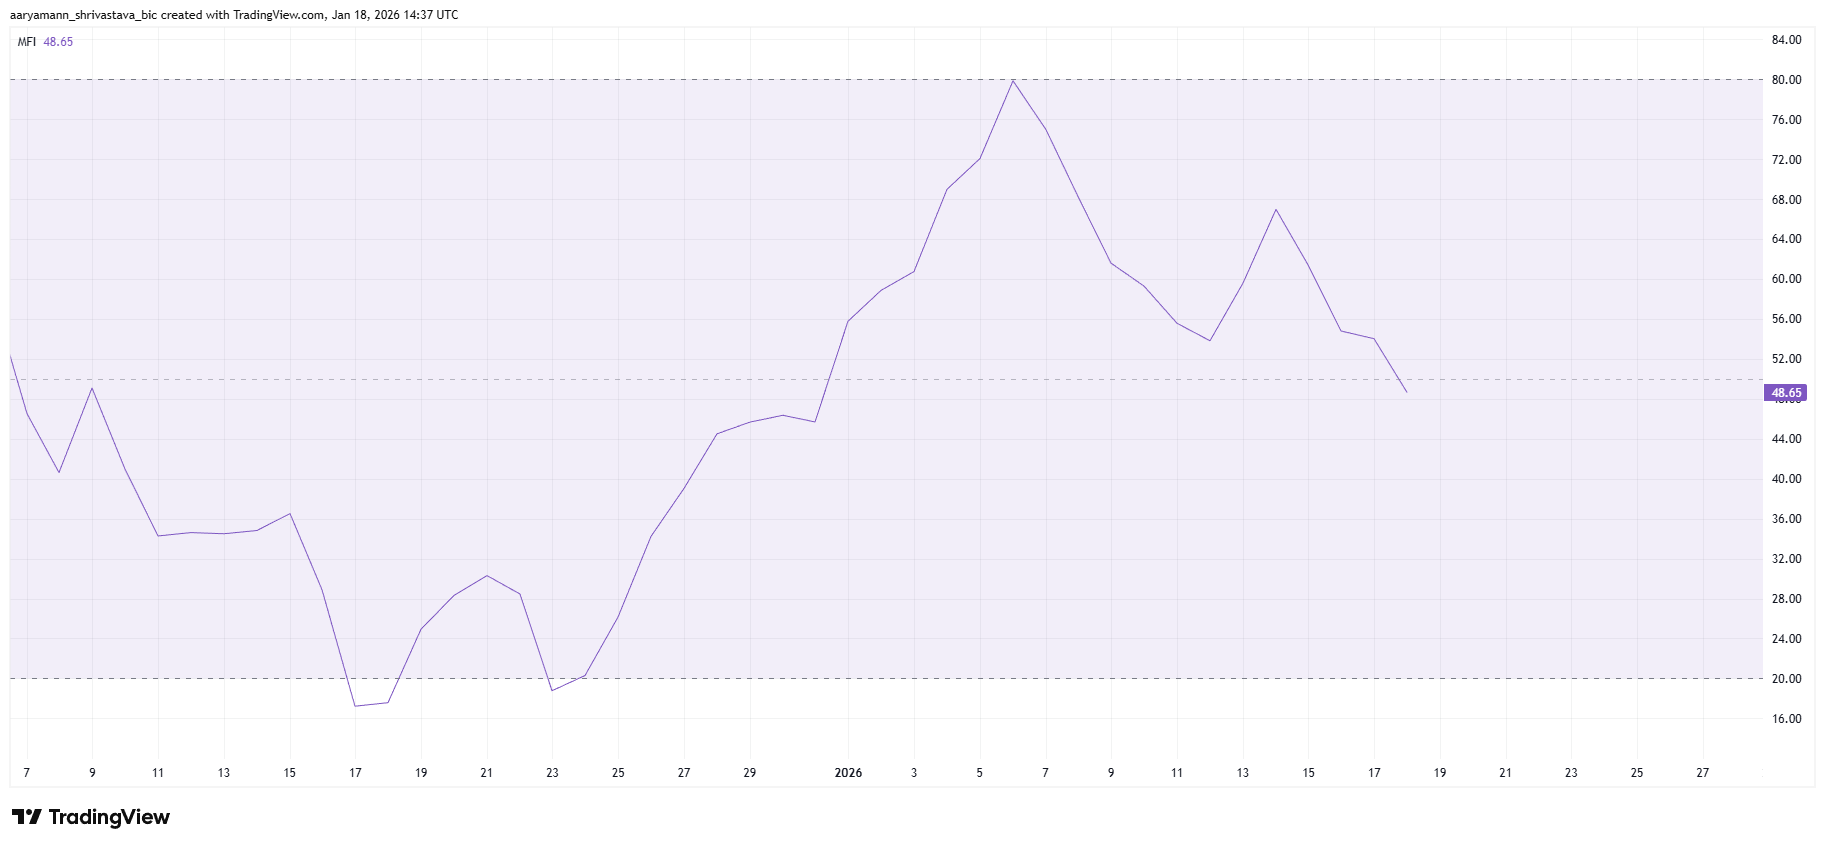 HBAR MFI. Source: TradingView
Macro data reinforces the downside risk facing Hedera. Liquidation maps show growing vulnerability among long traders.
However, if HBAR loses the immediate $0.114 support level, approximately $1.07 million in long positions could be liquidated. This would accelerate selling pressure.
Further downside would amplify the impact. A break below $0.112 could trigger over $2.71 million in long liquidations. These forced exits would add to market stress, intensifying bearish momentum and discouraging new long positions from entering the market.
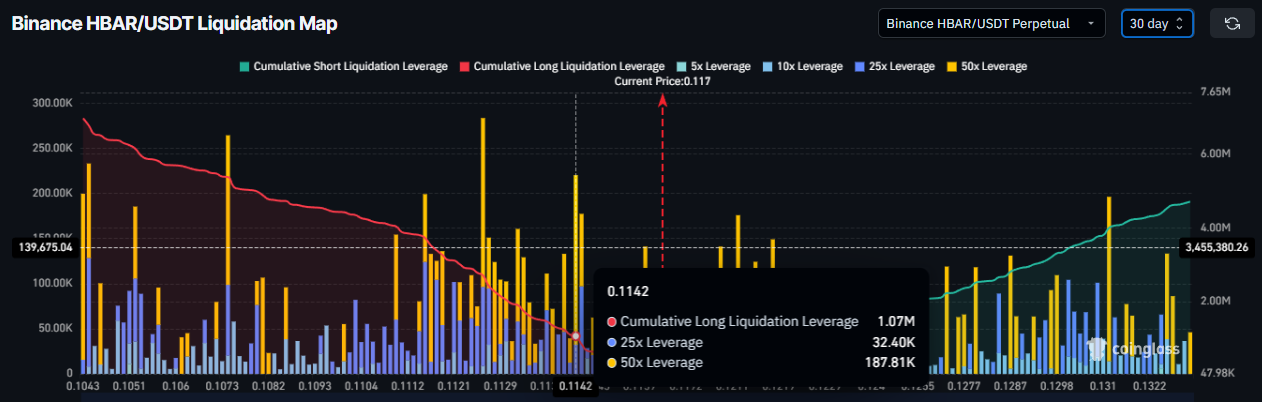 HBAR Price Analysis. Source: TradingView
HBAR Price Remains Under Downtrend
HBAR price has remained in a clear downtrend for nearly two months. At the time of writing, the token trades near $0.117. Price is holding marginally above the $0.114 support level, which has acted as a short-term defense against deeper losses.
Given prevailing bearish momentum, the probability of losing this support remains elevated. Thus, a breakdown below $0.114 would likely trigger the expected liquidations. Nevertheless, a move could drive HBAR toward $0.109, reinforcing the broader downward structure.
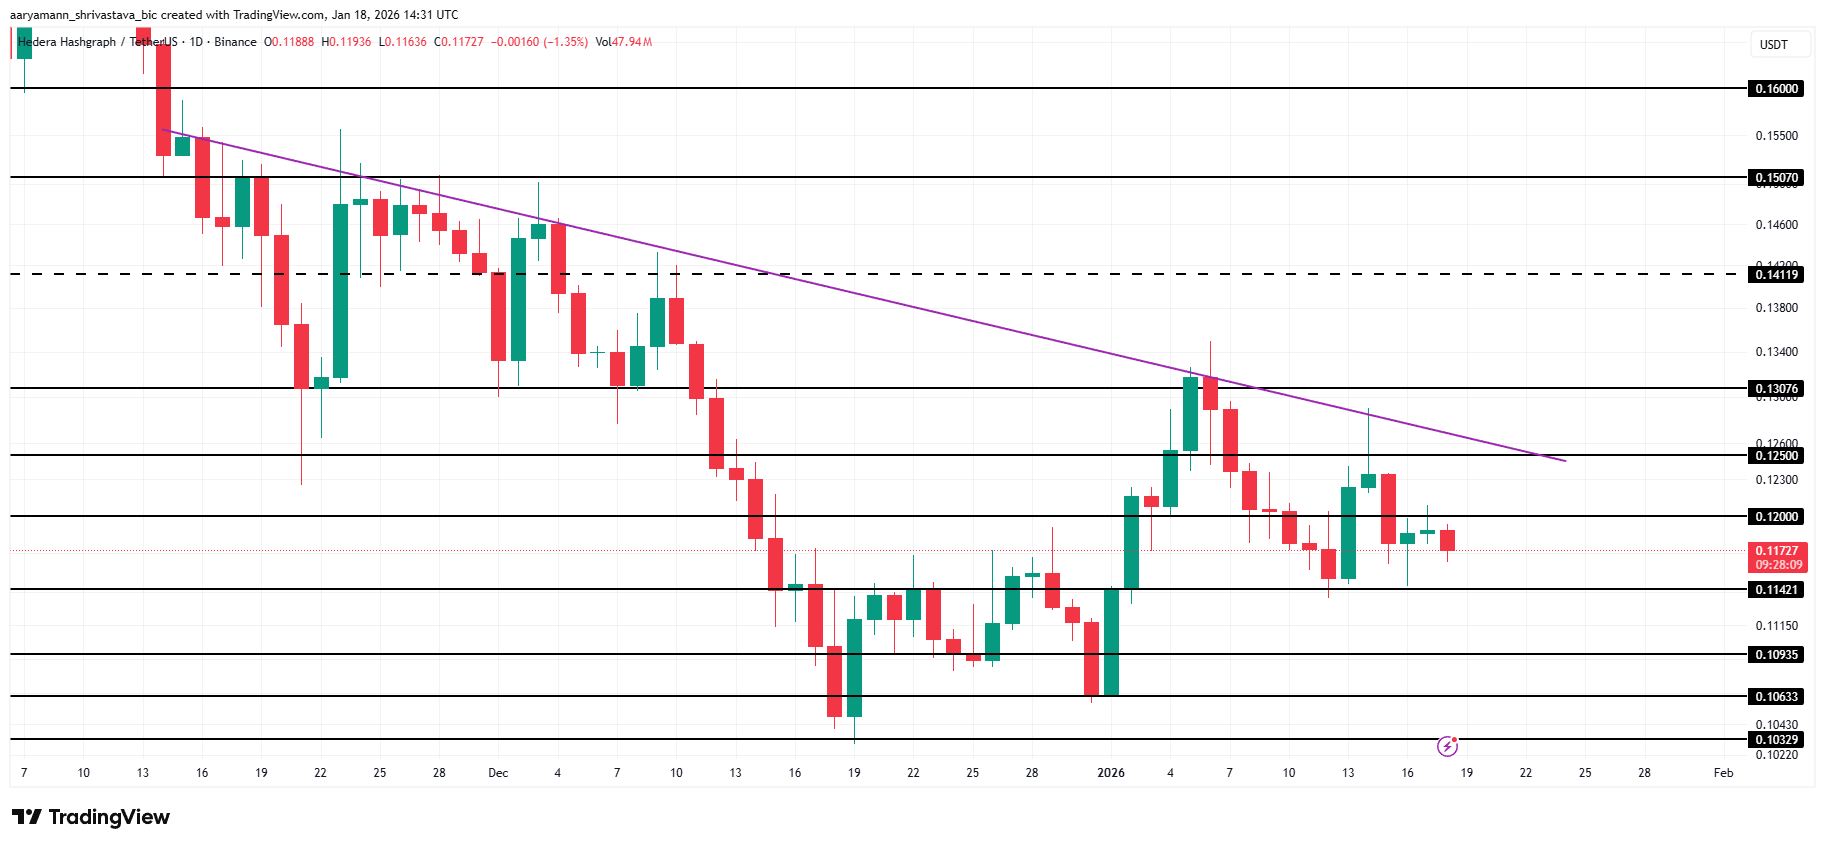 HBAR Price Analysis. Source: TradingView
Although a recovery scenario remains possible. If bullish momentum returns and selling pressure fades, HBAR could move higher. A sustained push above $0.120 would improve sentiment. Furthermore, breaching $0.125 would invalidate the bearish thesis, signaling renewed strength and short-term trend reversal.
0
0


 Manage all your crypto, NFT and DeFi from one place
Securely connect the portfolio you’re using to start.

0
0

0
0

0
0

0
0