
Bitcoin Price Prediction: Analyst Eye $100K Target in 2026, Here’s Why

0
0

Fidelity just made a big move. Clients bought $310.72 million worth of Bitcoin, according to a widely shared post, right as BTC is testing a key breakout zone.
Bitcoin Price Today is trading at $80,426.20, down 0.99% today, after breaking out of a tightening channel in the last few days.
This Bitcoin price prediction looks at what's behind the buying and whether the chart is really pointing toward $100K.
Market data checked on September 20, 2026.
Bitcoin Price Today: Market Overview
Metric | Value |
Price | $80,426.20 |
24h Change | -0.99% |
Daily Range | $80,104.97 – $81,300.96 |
Bitcoin News Today: Fidelity Clients Buy $310M in Bitcoin
A post from Whale Insider claims Fidelity clients purchased $310.72 million worth of BTC.
This is a BTC News & social media report on flow data, and CoinGabbar could not independently verify the exact figure, though it points to continued institutional demand around current levels.
Why Bitcoin Sentiment Is Bullish, But Cautious
Broader sentiment around BTC is described as bullish but cautious right now, with the price up 4.06% over the past week after reclaiming the $80K level. Community sentiment trackers show roughly 85% bullish versus 15% bearish. A few things are driving that mood:
Short squeeze rally: The recent surge past $81K was largely fueled by short liquidations, with over 64,000 BTC (worth around $250M) liquidated in a sharp move, and roughly 89% of that liquidation volume coming from short positions rather than longs.
Strong ETF inflows: US spot Bitcoin ETFs pulled in $433M in net inflows on September 18 alone, led by Fidelity's fund with $311M and BlackRock's with $108M, a sign of solid institutional demand.
Regulatory developments: Even though a major crypto market-structure bill failed in the Senate, the CFTC submitted new crypto rules to the White House, and the SEC granted a five-year exemption for tokenized stocks, both read by markets as steps toward clearer regulation.
Macro resilience: Bitcoin held above $80K despite a Fed rate hike and a stronger dollar this week, and JPMorgan has noted BTC could outperform gold as ETF-related hedging activity unwinds.
Source: Data From CoinGecko
Bitcoin Price Forecast: Technical Analysis
Bitcoin rallied hard through late August into early September, then spent the following two weeks cooling off inside a tightening descending channel, making lower highs and lower lows along two converging trendlines. 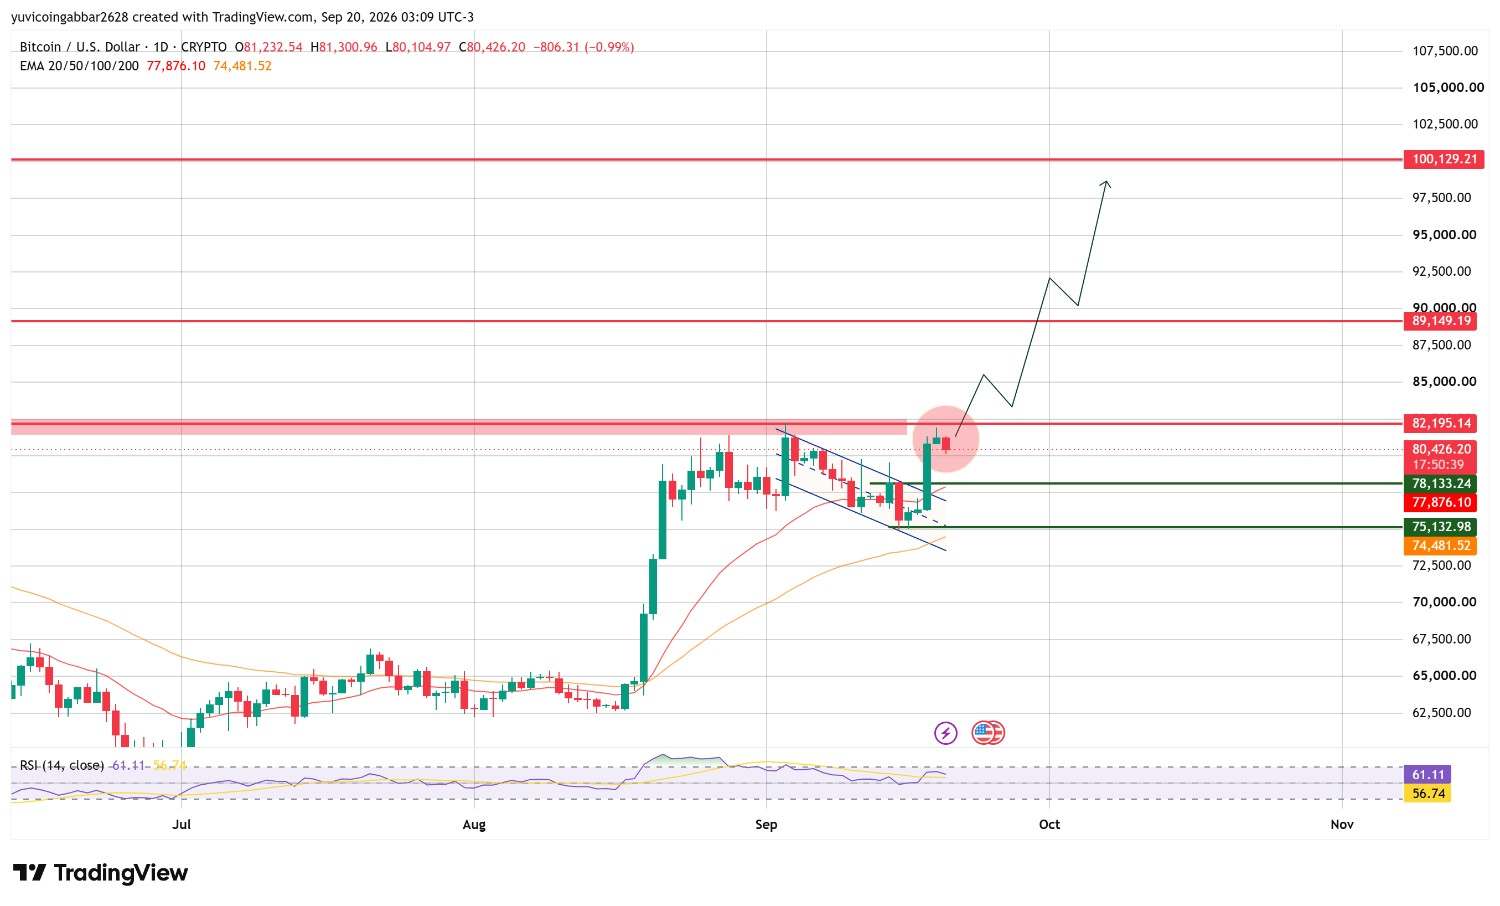
That kind of squeeze usually means the market is building up energy for its next move rather than settling into a real downtrend.
A few days ago, BTC broke cleanly above the upper trendline of that channel, and the price is now consolidating just under the $82,195.14 resistance zone, the same area marked on the chart as High.
It's currently trading at $80,426.20, after opening at $81,232.54, hitting a high of $81,300.96, and a low of $80,104.97, essentially holding its ground rather than giving the breakout back.
Below the price, the EMA cluster at 50 ema $74,481.52 to 20 ema $77,876.10 has flipped from resistance into support since the rally began, and it's held up through the recent consolidation.
RSI is reading 61.11, comfortably above the neutral 50 line but still well short of the 70 mark, usually read as overbought.
That combination a confirmed breakout, support holding, and momentum with room to run, is why $82,195.14 matters so much here: clearing it with volume would confirm the channel breakout has real follow-through, opening the door to $89,149.19 first and $100,129.21 further out on the chart's own projected path.
A rejection at $82,195.14 instead would suggest BTC needs more time inside this range before it's ready for that next leg.
Bitcoin Outlook: Support
$77,876.10 to $78,133.24 is the EMA zone to hold first. Below that, $75,132.98 and $74,481.52 mark the deeper support levels.
Bitcoin Forecast: Resistance
$82,195.14 is the nearest resistance and the level standing between here and a bigger move. Clearing it opens the path toward $89,149.19 and further out, $100,129.21.
What Confirms the Breakout and What Invalidates It?
Scenario | Trigger | Likely Outcome | Invalidation |
Breakout continues | Hold above $78,133, clear $82,195 | Push toward $89,149, then $100,129 | Close below $77,876 |
Range hold | Consolidate $78,000–$82,195 | Base before next move | Break below $75,132 |
Breakdown | Close below $75,132 | Slide toward $74,481 | Reclaim $78,133 |
Bitcoin Price Prediction: Can Bitcoin Reach $100K?
It's the chart's own projected target if this breakout keeps building. BTC would first need to clear $82,195.14, then $89,149.19, so it's a multi-stage move rather than something that happens in a single leg.
Bitcoin Price Prediction 2026: Expert Analysis
According to CoinGabbar analysts, the Fidelity buying and the RSI reading are both pointing in the same direction: institutional demand alongside room for more upside without being overbought.
$82,195.14 is the level that decides whether this consolidation turns into the next leg toward $100K.
Disclaimer
This article is for informational purposes only and isn't financial advice. Crypto markets are volatile. Always do your own research before making any trading decisions involving BTC.
0
0

 Verwalten Sie alle Ihre Kryptowährungen, NFTs und DeFi an einem Ort
Verbinden Sie sicher das Portfolio, das Sie zu Beginn verwenden möchten.


