XRP Price Analysis - Ripple drops 4% after failing to break 3000 sat - are we headed to bearish conditions?
5
1
Key Highlights:
- XRP dropped by a total of 4% in today’s trading session, bringing the price for the cryptocurrency down to $0.27.
- This price fall was helped by Bitcoin dropping beneath $10,000 but is mainly due to XRP/BTC dropping beneath 2800 SATS.
| ⠀Ripple price: | $0.271 |
|---|---|
| ⠀Key XRP resistance levels: | $0.275, $0.28, $0.286, $0.29, $0.30 |
| ⠀Key XRP support levels: | $0.268, $0.265, $0.26, $0.254, $0.251 |
*Price at the time of writing
XRP saw a 4% price drop over the past 24 hours of trading as the cryptocurrency drops from $0.282 to the current level of $0.27. This price fall was largely a result of XRP/BTC failing to break 3000 SAT and dropping beneath 2800 SAT. It was also helped by the fact that Bitcoin rolled over and dropped beneath $10,000.
Despite the recent price fall, XRP is still up by a total of 27.5% over the past 30 days of trading. However, relative to other altcoins this is a rather muted price hike. Sure, it has beaten the 21.80% 30-day price growth from Bitcoin but it is far behind the 51% 30-day price increase that Ethereum witnessed.
In fact, excluding Bitcoin (and Tether for that matter), XRP is the weakest performing altcoin out of the top 15 ranked cryptocurrency projects.
Nevertheless, XRP remains ranked in the 3rd position as it currently holds a total market cap value of around $11.85 billion. It is around $12 billion behind the 2nd ranked position, Ethereum, and is quickly being chased by Bitcoin Cash which sits at rank 4 and is only $3.8 billion behind XRP.
How to buy XRP (XRP) on Binance
XRP Price Analysis
What has been going on?
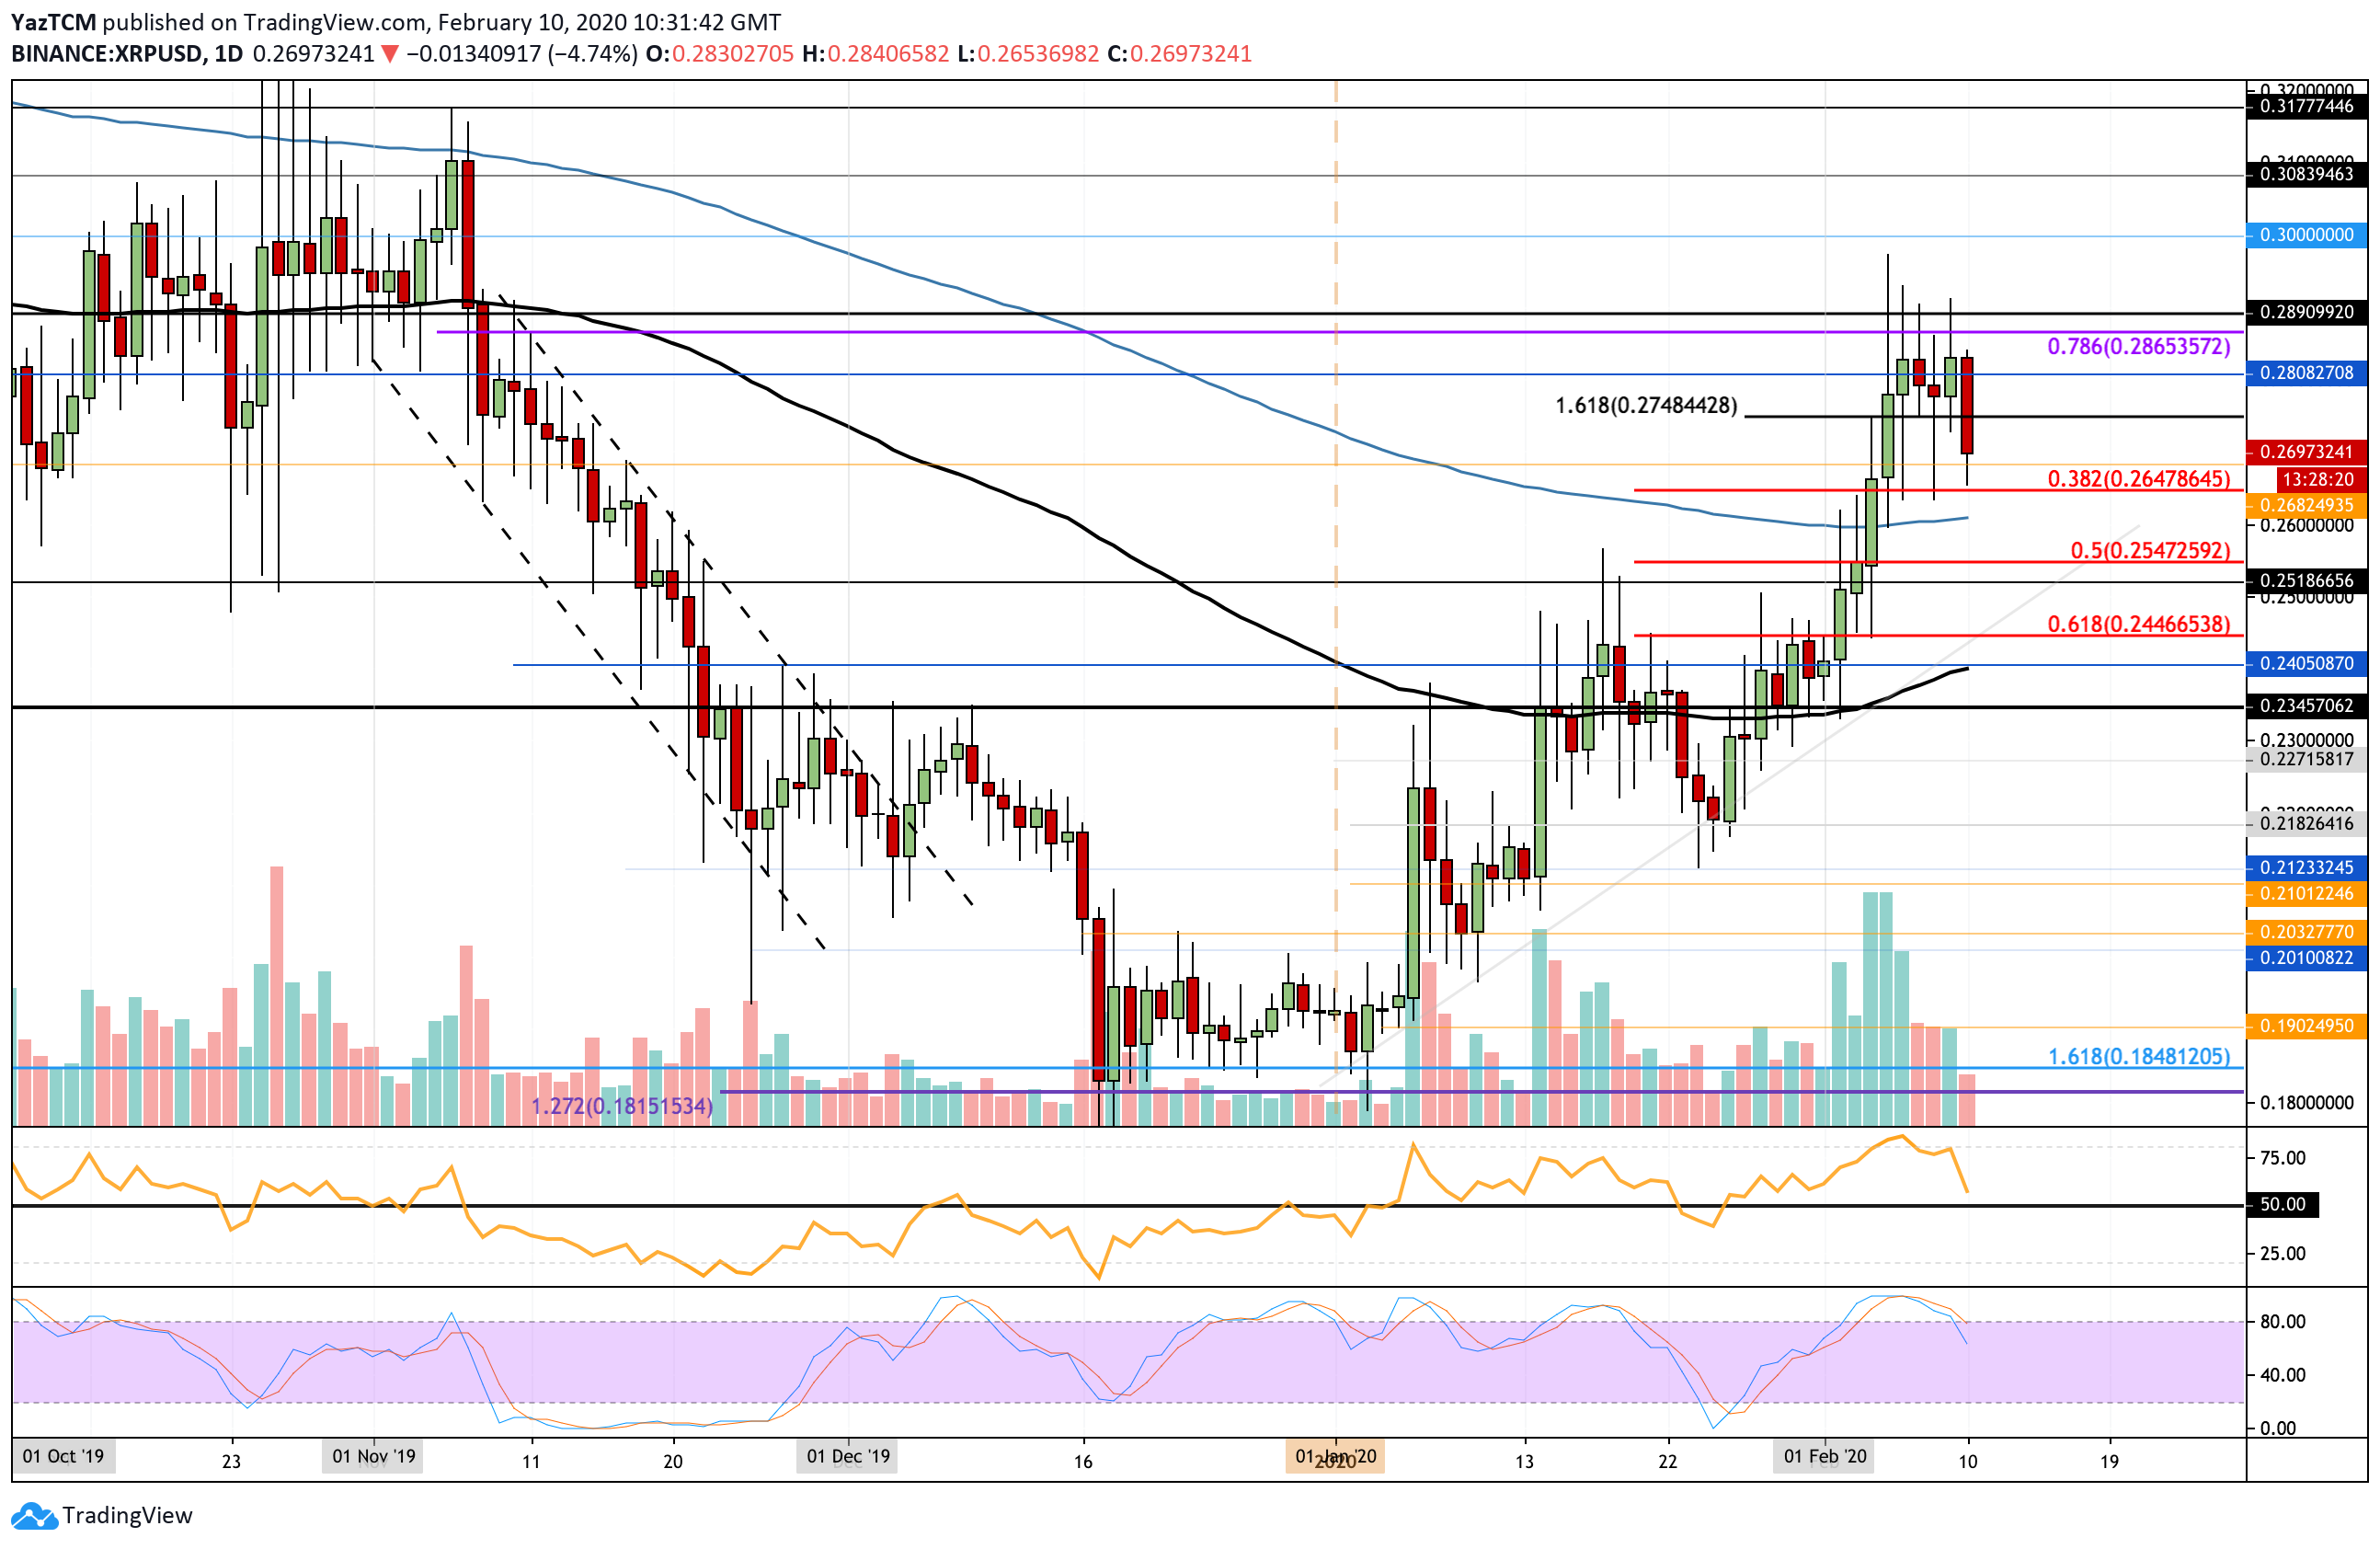
Since our last analysis, we can see that XRP did in fact break back above the $0.275 resistance level and climbed further higher toward $0.285. It continued to try to break resistance at $0.29 but failed to do so on each individual attempt.
XRP rolled over in today’s session as it dropped beneath $0.28 and continued to fall further lower to the current support level at $0.269.
XRP price short term prediction: Bullish/Neutral
XRP still remains bullish in the short term, however, if it continues to drop and breaks beneath the support at the 200-day EMA at around $0.26 the market will turn to a neutral trading condition. A further drop beneath $0.23 could possibly turn XRP bearish with a break beneath $0.21 confirming the bearish trend.
If the sellers do continue to push XRP lower, the first level of strong support lies at $0.264 which is provided by a short term .382 Fibonacci Retracement level. Beneath this, support lies at $0.26 (200-days EMA), $0.254 (short term .5 Fib Retracement), and $0.251.
If the selling continues to drive XRP further beneath $0.25, additional support is then expected at $0.244 (.618 Fib Retracement), $0.24 (100-day EMA), and $0.2345.
What if the bulls increase their pressure?
ON the other hand, if the buyers can defend the support at $0.264 (or the 200-day EMA at $0.26) and rebound, we can expect strong resistance at $0.28 and $0.2850. If they can break here, additional close resistance lies at $0.286, provided by the long term bearish .786 Fibonacci Retracement level, and $0.289.
If the buyers continue to drive XRP above $0.29, additional resistance is then located at $0.30, $0.308, $0.31, and $0.3177.
What are the technical indicators showing?
The indicators are showing a clear rollover. The RSI dropped from overbought conditions as it makes its way toward the 50 level. This shows that the previous bullish momentum is fading, and if it continues to drop further beneath 50 we can expect the bears to start taking control over the market momentum.
Additionally, the Stochastic RSI recently produced a bearish crossover signal which has also helped the bullish momentum within the market to fade slightly.
What has been going on?
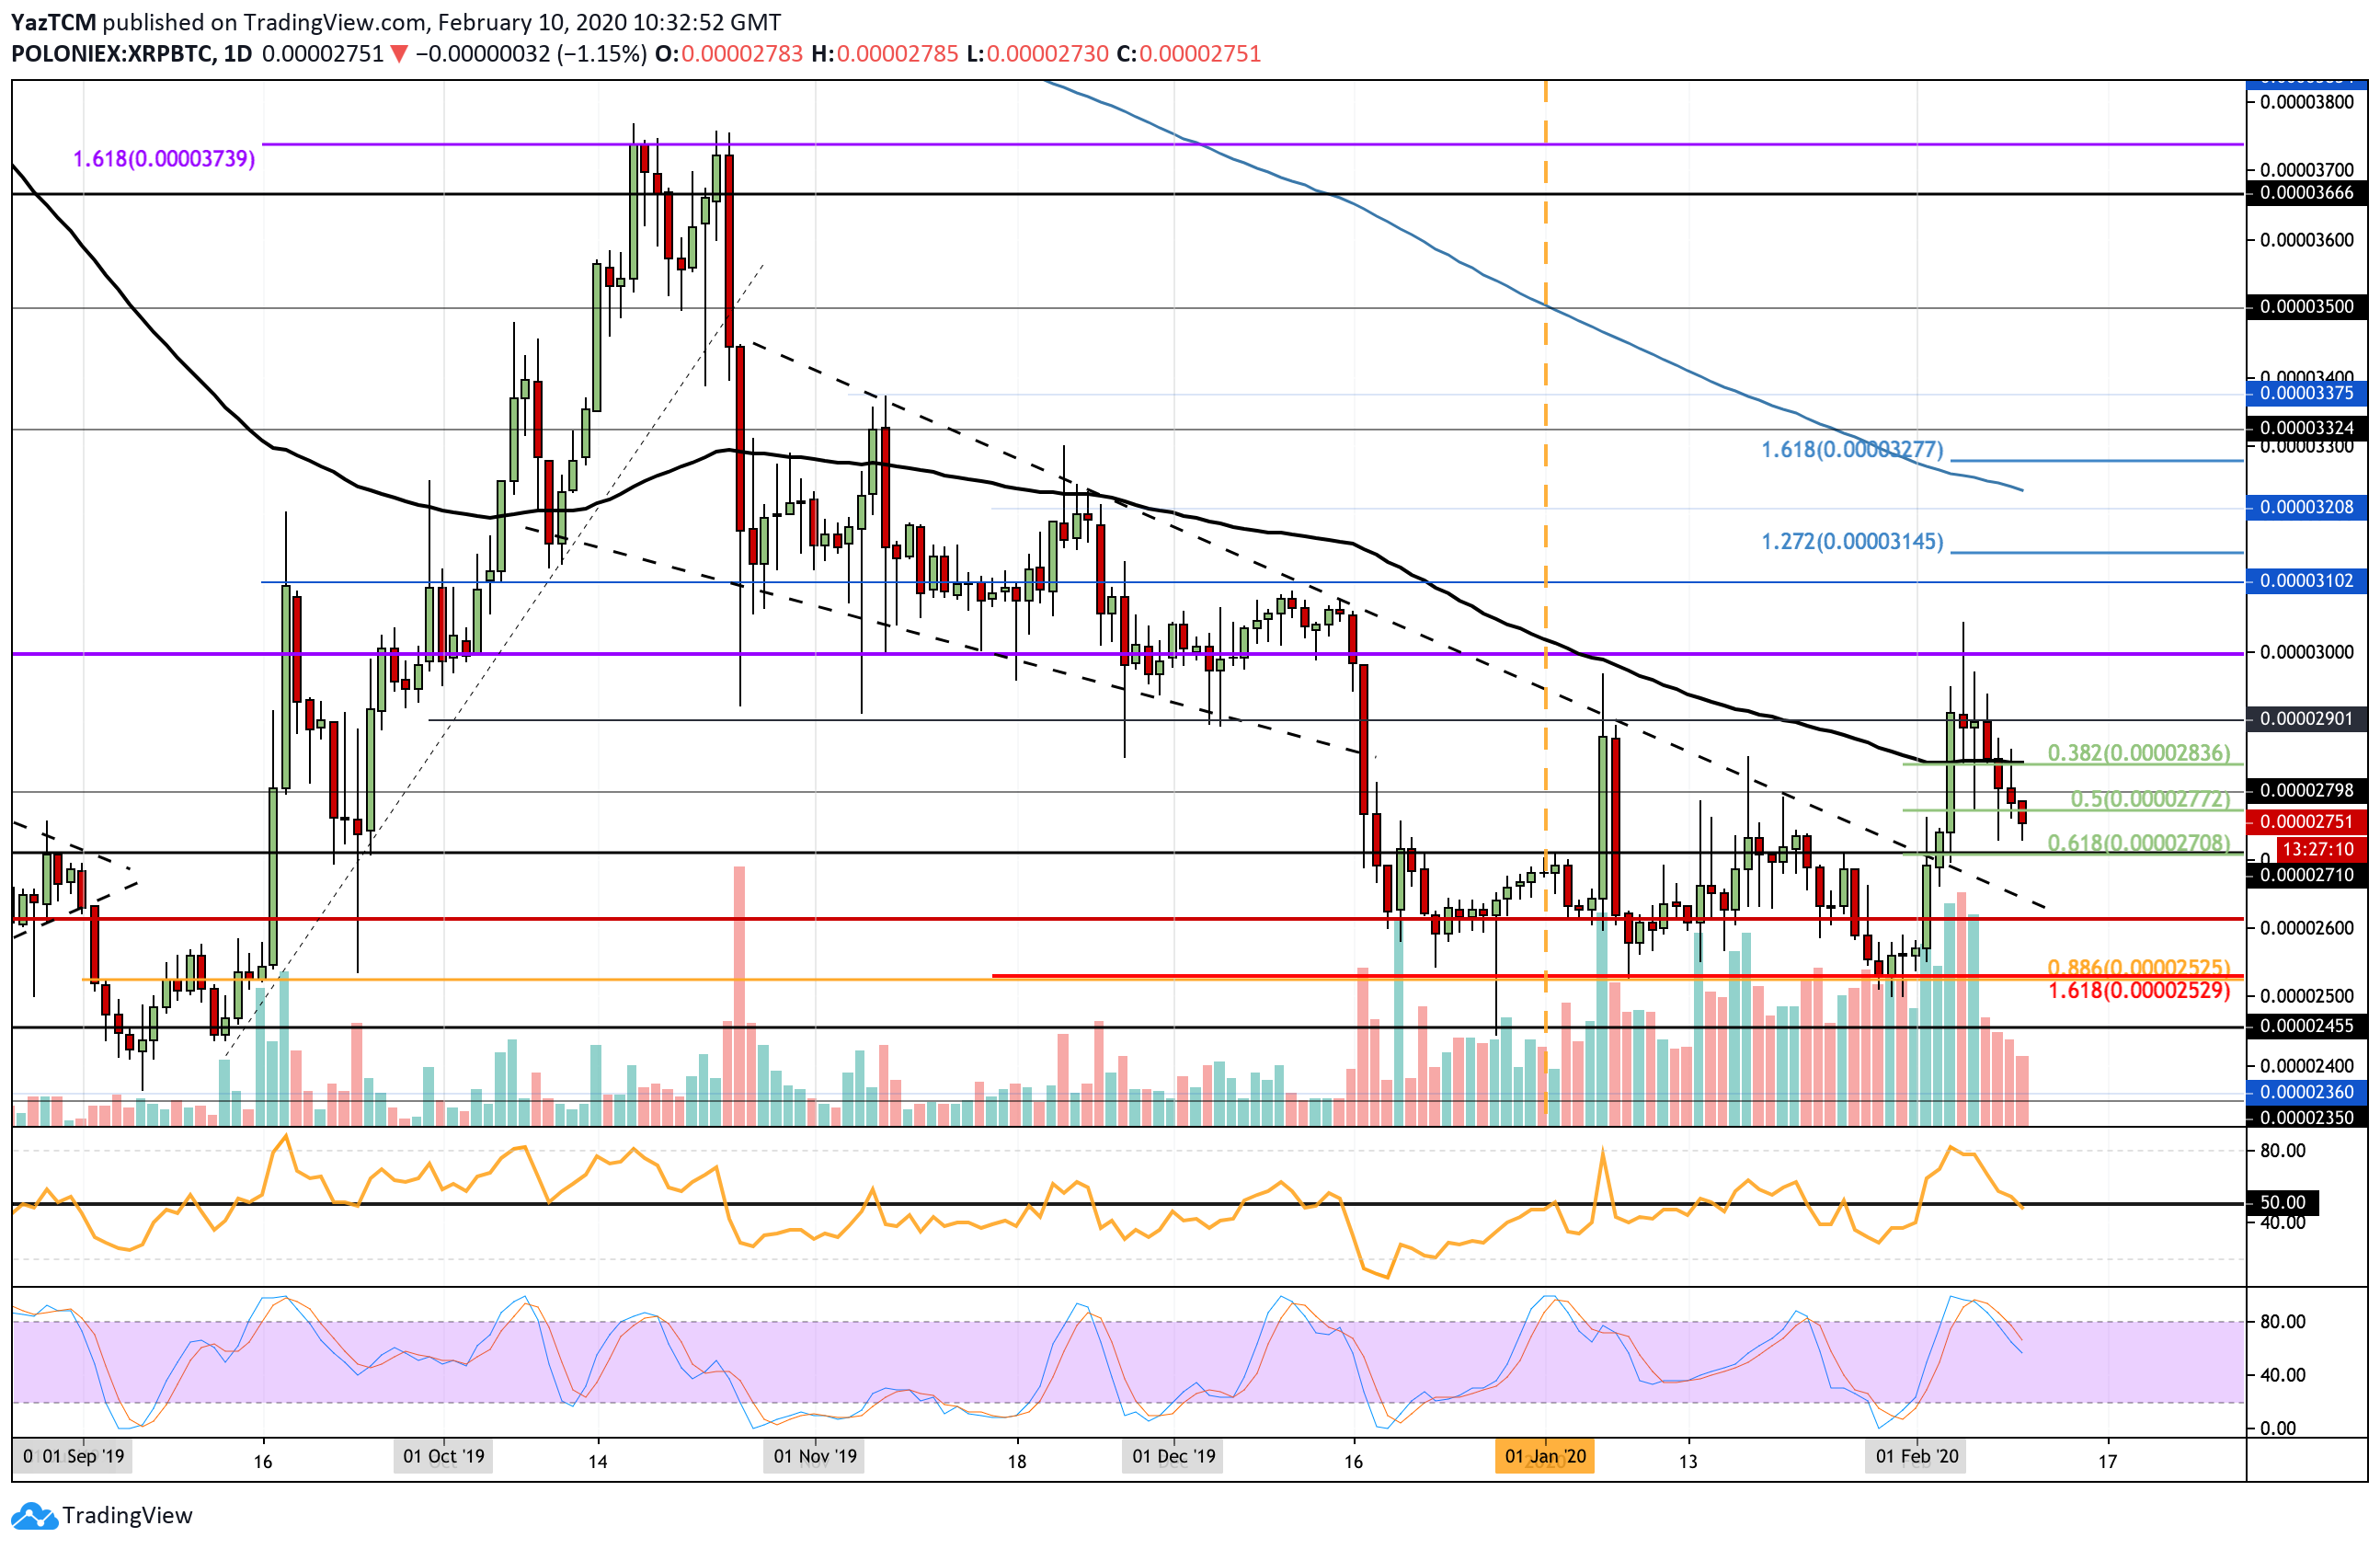
Taking a look at the daily chart for XRP/BTC, we can see that XRP was unable to make any movement above the resistance at 2900 SAT. The market rolled over from here and began to drop quite significantly.
It went on to fall beneath support at 2935 SAT (100-day EMA and .382 Fib Retracement), 2800 SAT, and 2772 SAT to reach the current trading price at around 2750 SAT.
XRP price short term prediction: Neutral
The failure to break the 3000 SAT resistance and consequential break beneath the 100-day EMA has caused XRP to turn into a neutral trading condition. We should be wary because a further drop beneath 2700 SAT could turn the market bearish with a break beneath 2500 SAT confirming the bearish trend.
If the sellers continue to drive the market lower, the first level of support is expected at 2700 SAT which is provided by the short term .618 Fibonacci Retracement level. Beneath this, additional support is to be expected at 2600 SAT and 2525 SAT (long term .886 Fibonacci Retracement).
If XRP falls beneath 2525 SAT, things could get pretty ugly for the cryptocurrency, in which case, we can expect additional support at 2455 SAT, 2400 SAT, and 2360 SAT.
What if the bulls increase their pressure?
On the other hand, if the buyers can defend the support at 2700 SAT and rebound, they will have to grind higher back toward 3000 SAT. On the way up, resistance will be expected at 2800 SAT, 2840 SAT (100-day EMA), 2900 SAT, and then 3000 SAT.
If they can break the resistance at 3000 SAT, higher resistance is to be expected at 3100 SAT, 3145 SAT, and 3210 SAT (200-day EMA).
What are the technical indicators showing?
The technical indicators are also showing a rollover in this market. However, things are looking pretty dull as XRP has started to penetrate beneath the 50 level on the RSI. If it continues to break the 50 level, we can expect the bearish momentum to continue to grow as we head toward 2500 SAT.
Previous XRP price analysis
At CoinCodex, we regularly publish price analysis articles focused on the top cryptocurrencies. Here's 3 of our most recent articles about the price of XRP:
5
1

 Manage all your crypto, NFT and DeFi from one place
Securely connect the portfolio you’re using to start.

2
0

0
3

0
0

0
0