
Chainlink Price Today: LINK Hits $11.46 as RSI Signals Overbought Warning

0
0

As of August 26, 2026, Chainlink price today trades at $11.46, holding above every major moving average after a rally that outpaced the broader market. LINK’s strength stands out while total crypto market capitalization slipped 2.38% to roughly $2.66 trillion, according to CoinGecko.
Key takeaways
- LINK trades at $11.46 on August 26, 2026, above its 20, 50, and 200 EMAs.
- The daily RSI reads 72.86, putting Chainlink deep into overbought territory.
- The hourly RSI sits at 52.07, showing a market that is consolidating.
- Daily and hourly pivots highlight the $11.30–$11.55 zone as the battleground.
- The Fear & Greed Index reads 65, while Bitcoin dominance holds at 59.18% and total crypto market cap fell 2.38% to roughly $2.66 trillion.
What the Daily Chart Is Actually Saying
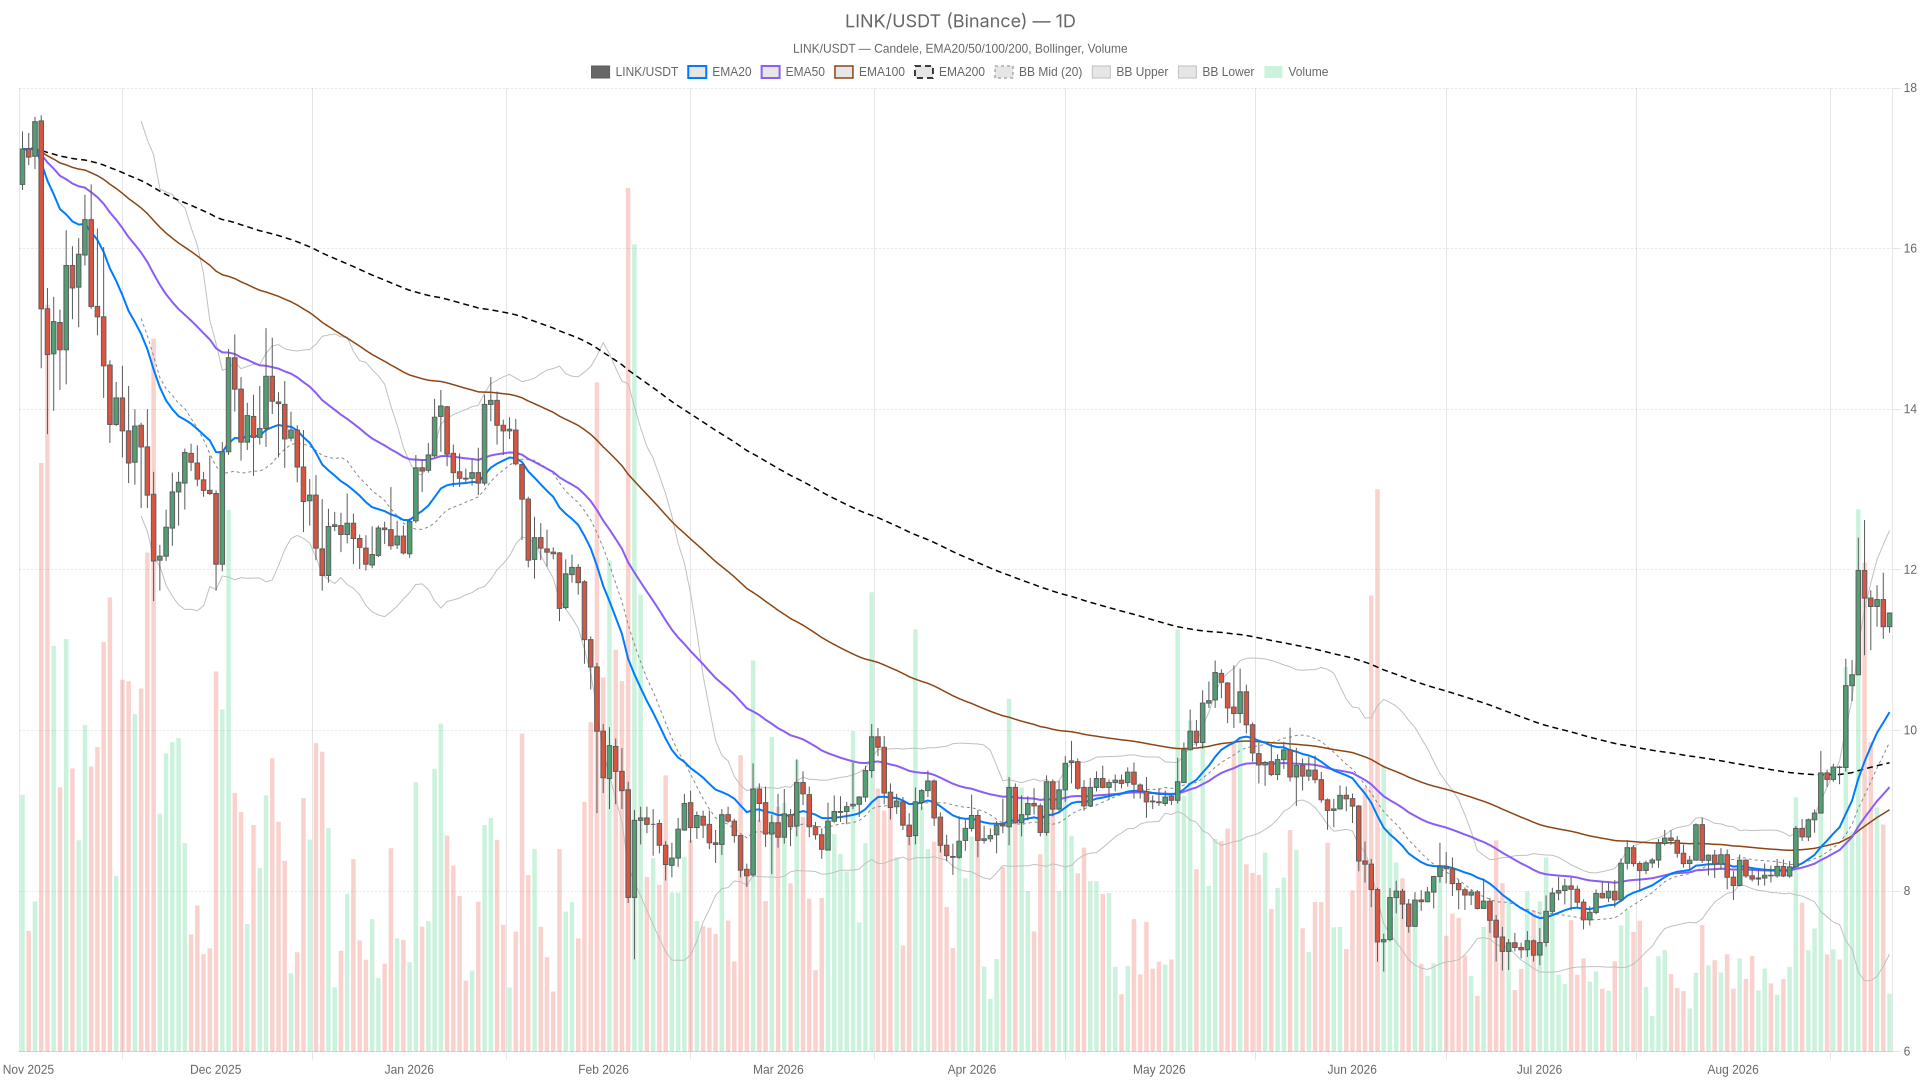
The daily chart shows LINK trading far above all three major moving averages, a signature of an extended uptrend rather than a market in balance. The close at $11.46 sits well above the 20 EMA at $10.23, the 50 EMA at $9.29, and the 200 EMA at $9.60. That separation marks a strong advance. The system’s regime tag reads “neutral,” but price action suggests a market that ran hard and has not cooled off yet.
However, the daily RSI at 72.86 confirms the overextension. LINK is deep in overbought territory, which does not guarantee an immediate reversal but does leave the trend vulnerable to a sharp pullback or a pause. The daily MACD remains constructive, with the line at 0.85 against a signal of 0.68 and a positive histogram of 0.17. The trend has not rolled over, yet the gap between price and its moving averages tends to get corrected sooner or later.
Bollinger Bands add another layer of context. With the mid-band at $9.85 and the upper band at $12.49, price at $11.46 trades comfortably inside the upper half of the range without tagging the band. The daily ATR of 0.69 shows how much room LINK has to move in a single session. Daily pivots place the pivot point at $11.38, resistance at $11.55, and support at $11.30, a tight band where price is coiling.
The Hourly Chart Tells a Quieter Story
The hourly chart shows a market taking a breather rather than pushing aggressively in either direction. On the 1H timeframe, price at $11.46 sits almost exactly between the 20 EMA at $11.41 and the 50 EMA at $11.48. The 200 EMA at $11.03 acts as a longer-term floor.
Meanwhile, the hourly RSI sits at 52.07, a sharp contrast to the daily overbought reading. The hourly MACD is essentially flat, with the line at -0.05 against a signal of -0.06 and a tiny positive histogram of 0.01. That suggests momentum has stalled rather than reversed. The hourly Bollinger Bands are tight, with the mid-band at $11.40, the upper band at $11.58, and the lower band at $11.21. The ATR of just 0.12 confirms compressed volatility. Hourly pivots place the pivot point at $11.39, resistance at $11.54, and support at $11.32, lining up closely with the daily pivots and reinforcing the $11.30–$11.55 battleground.
The disagreement between timeframes is the real story here. The daily chart says LINK is stretched and overbought, while the hourly chart shows a quiet, digesting market. That said, this combination usually resolves in one of two ways. Either the pause is temporary and the daily trend reasserts itself, or the daily overextension catches up and drags price into the hourly range’s lower half.
15-Minute View: Execution Context Only
On the 15-minute chart, the RSI at 63.64 and a slightly positive MACD histogram of 0.01 suggest short-term buyers are still nudging price higher. They are testing the upper Bollinger Band at $11.45 and the tight pivot resistance at $11.48. This context is useful only for timing entries or exits within the broader hourly consolidation. Intraday momentum, for now, leans mildly bullish rather than bearish.
Bullish Scenario
The bullish case depends on the hourly chart resolving upward. If LINK reclaims and holds above the 1H 50 EMA at $11.48 and clears the daily R1 at $11.55, the path toward $12.49 opens up. That level matches the daily upper Bollinger Band. This would confirm the daily uptrend is continuing rather than exhausting. The overbought RSI would then reflect a genuine momentum phase rather than a warning sign. Continuation buying above $11.55 with hourly MACD flipping decisively positive would be the clearest confirmation. This scenario would be invalidated if price fails repeatedly at $11.54–$11.55 and prints lower highs on the hourly.
Bearish Scenario
The bearish case rests on the overbought daily RSI at 72.86 and the wide gap to the 20 EMA at $10.23. That is a classic setup for a mean-reversion pullback. If hourly price breaks below the 50 EMA at $11.48 and then loses the S1 pivot at $11.32, a corrective move toward $10.23 could open. That level matches the daily 20 EMA. A deeper flush could reach the daily mid-Bollinger-Band near $9.85. A drop in total market cap alongside Greed-level sentiment at 65 is exactly the kind of complacent backdrop where sharp corrections catch late longs off guard. This scenario would be invalidated if buyers defend the $11.30–$11.32 zone and push back above the hourly 50 EMA with conviction.
Positioning and Risk
Right now, Chainlink price today reflects a market caught between two truths. The daily trend is unmistakably bullish in structure, but it is stretched enough that a cooling-off period would not surprise. The hourly chart’s neutrality suggests that cooling-off may already be underway. Daily volatility, with an ATR of 0.69, is meaningfully higher than the hourly ATR of 0.12. The next real move is therefore more likely to show up on the daily close than in intraday noise. The backdrop includes a falling total market cap alongside a Greed reading, and Bitcoin dominance holds near 59%. This is not a moment to assume the trend continues on autopilot. Anyone tracking LINK should weigh the daily overextension against the hourly stall and size decisions around the $11.30–$11.55 range.
FAQ
What is Chainlink’s price on August 26, 2026?
LINK trades at $11.46, well above its 20 EMA at $10.23, 50 EMA at $9.29, and 200 EMA at $9.60 on the daily chart.
Is Chainlink overbought right now?
Yes, the daily RSI reads 72.86, which puts LINK deep in overbought territory and leaves it vulnerable to a pullback or a pause.
Where is the key support and resistance for LINK?
Daily pivots place resistance at $11.55 and support at $11.30, while the hourly chart highlights the same $11.30–$11.55 zone as the battleground.
What does the hourly chart suggest?
The hourly RSI at 52.07 and a flat MACD show a market that is consolidating and digesting the recent rally rather than pushing higher.
Disclaimer: This article is for informational purposes only and does not constitute financial advice, an investment recommendation, or a solicitation to buy or sell any financial instrument or cryptocurrency. The analysis provided is not indicative of future results. Investing in crypto assets and financial markets carries a high risk of capital loss. Always do your own research (DYOR) and consult a qualified financial advisor before making any decision.
Article produced with the assistance of artificial intelligence and reviewed by the editorial team.
0
0

 Manage all your crypto, NFT and DeFi from one place
Securely connect the portfolio you’re using to start.


