
Cardano Price Prediction: One Retest Could Change Everything

0
0

Cardano price prediction is back in the spotlight after ADA's last setup played out almost perfectly, with every target from our broadening wedge flip zone call getting tagged in full.
Now attention turns to the next big question on the chart: whether this rising structure can hold or whether a bigger test is coming.
Cardano Price Right Now
| Metric | Value |
| Price | $0.1666 |
| 24h Change | -4.24% (-$0.007394) |
| Market Cap | $6.09B |
| Futures Volume (24h) | $347.33M |
| Spot Volume (24h) | $48.61M |
| Open Interest | $395.26M |
| Circulating Supply | 36.48B ADA |
| Total Supply | 44.99B ADA |
| Max Supply | 45.00B ADA |
Price taken from the live TradingView chart, with volume, market cap, open interest, and supply figures from Cardano data on CoinGlass, as of July 24, 2026, around 11:22 AM IST.
For a live look at the same numbers, our Cardano coin tracker on CoinStats keeps this data updated in real time.
Methodology And Data Sources
This Cardano price prediction uses the 1-hour ADA/USDT perpetual chart on Bitget via TradingView for price structure, with volume, open interest, and market cap figures from CoinGlass, and liquidation flow from CoinGlass's $ADA liquidation tracker.
All levels are treated as invalidated only on a confirmed candle close beyond the stated trigger, not an intraday wick. This is a short-term, intraday read and is not intended as a long-term Cardano price forecast.
This analysis combines market structure, liquidity zones, and momentum behavior rather than relying on indicators alone.
Cardano Liquidation Data Today
Liquidation activity over the past day leans heavily toward longs getting caught out, though the shortest window shows a different picture.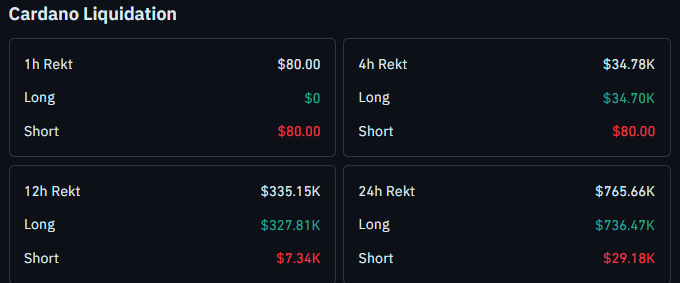
Over the past hour, just $80.00 was liquidated, and all of it came from short positions, with zero long liquidations in that window.
The 4-hour figure shows $34.78K in total liquidations, made up of $34.70K in longs against only $80.00 in shorts, a sharp shift from the hourly read.
Over 12 hours, the total climbs to $335.15K, with $327.81K from longs and $7.34K from shorts.
Across the full 24 hours, liquidations reach $765.66K, and longs account for $736.47K of that figure, while shorts make up the remaining $29.18K.
The heavy skew toward long liquidations across the wider windows lines up with the pullback from recent highs, while the short-lived flip in the 1-hour window suggests late sellers are the ones getting caught out closer to the current price.
A full breakdown is available through the ADA liquidation tracker on CoinGlass.
Cardano Price Prediction: 1-Hour Chart Analysis
On the 1-hour chart, $ADA has been climbing inside an ascending trendline structure.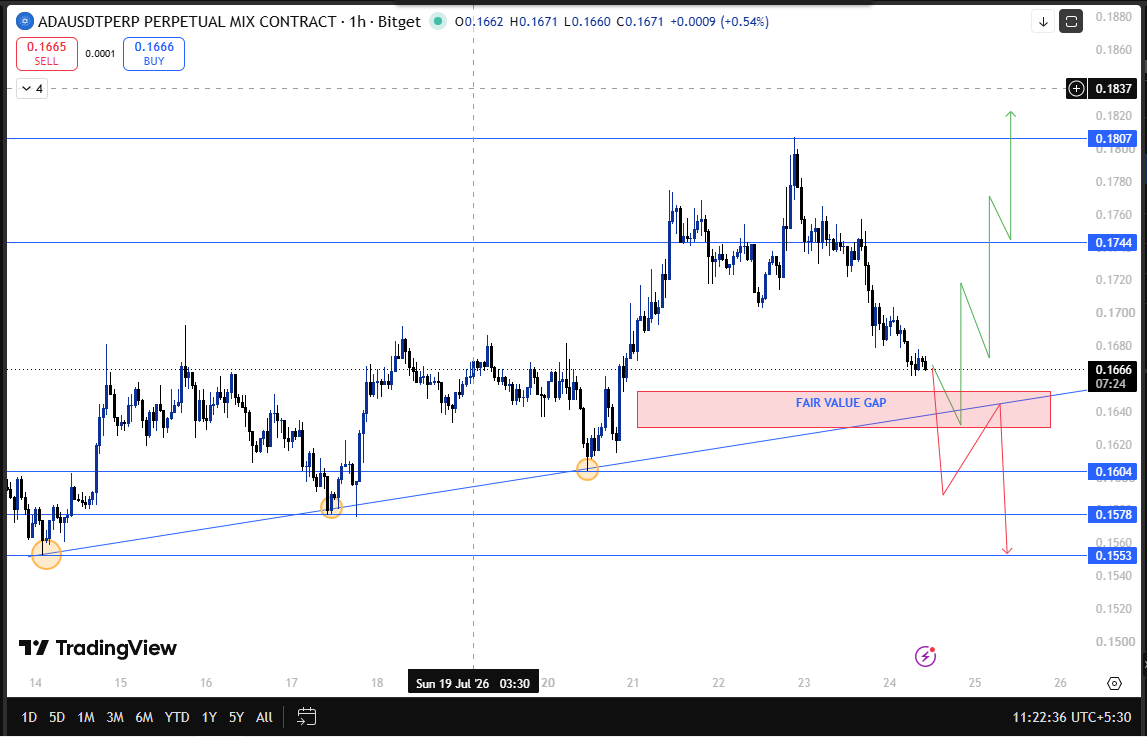
The first touch anchored the trendline low, and price came back to test it a second time, managing to sustain right near a recent swing high without breaking down.
The third interaction with the ascending trendline helped $ADA extend higher before price rotated back toward the same support zone for another test.
The price is now above a fair value gap between $0.1653 and $0.1631, right where the ascending trendline also lines up.
The fair value gap overlaps almost perfectly with the ascending trendline, creating a confluence zone where buyers often attempt to defend price during healthy pullbacks.
This is often where buyers make their next stand, a setup similar to the one covered in our descending channel break coverage.
If $ADA holds support in this zone, the path opens up toward $0.1744, with $0.1807 as the next level beyond that.
If price instead breaks down and closes below $0.1604, that would mark a clear failure of the trendline structure, with $0.1578 and $0.1553 next in view.
Cardano Technical Snapshot
| Indicator | Signal |
| Trend | Ascending trendline intact after three touches, price now testing support |
| Structure | A higher high formed on the third tap, trendline and FVG confluence in play |
| Liquidations | Longs dominate the 12h and 24h totals; shorts absorbed the hourly pressure |
| BTC Correlation | Broader Bitcoin direction remains a swing factor for how this test resolves |
For more on how ADA has handled trendline retests recently, our ADA next move loading breakdown covers a similar stage of the setup.
Cardano Support And Resistance Levels To Watch
| Type | Level | Note |
| Resistance 2 | $0.1807 | Extended upside target |
| Resistance 1 | $0.1744 | First target if trendline support holds |
| Current Price | $0.1666 | Just above the FVG zone, trendline test in progress |
| Support Zone | $0.1653 to $0.1631 | Fair value gap aligning with the ascending trendline |
| Support 1 | $0.1604 | A confirmed close below flips the setup bearish |
| Support 2 | $0.1578 | Next level on a confirmed close below $0.1604 |
| Support 3 | $0.1553 | Deeper support beyond $0.1578 |
Risk-Reward Table
| Case | Trigger | Target |
| Bull Case | Holds support in the $0.1653 to $0.1631 zone | Move toward $0.1744 and then $0.1807 |
| Bear Case | Breaks and closes below $0.1604 | Slide toward $0.1578 and then $0.1553 |
Invalidation Level
The bullish structure on ADA stays intact as long as the price holds above $0.1604 on a closing basis.
A confirmed close below that level would invalidate the ascending trendline setup and shift attention toward $0.1578, then $0.1553.
If price instead closes above $0.1744, that is treated as confirmation the trendline structure is extending higher, with $0.1807 next in view.
This lines up with the closing-basis logic used in our ADA breakout analysis, where a similar trigger determined the next leg.
Historical Context
The last Cardano setup covered in our broadening wedge flip zone call played out cleanly, with the previous structure reaching its projected resistance targets before the current pullback developed.
Although the previous setup reached its projected targets, this structure still requires independent confirmation from price action on how this current ascending trendline and FVG confluence are being read, though each setup still has to prove itself on its own terms.
Whether ADA holds this zone and pushes for $0.1744 and $0.1807, or breaks down toward $0.1578 and $0.1553, should become clear over the next several candles.
How Bitcoin Could Influence $ADA
While this setup is based on $ADA's own 1-hour chart, Bitcoin's direction remains an important backdrop.
A stable or rising Bitcoin would improve the odds of $ADA holding this trendline and working toward $0.1744 and beyond.
A sharper Bitcoin pullback, on the other hand, would raise the chances of ADA losing $0.1604 and sliding toward $0.1578 or $0.1553, regardless of the current trendline structure.
For a broader look at how ADA has responded to market-wide catalysts before, our ADA hard fork rally coverage is worth a look.
$ADA has historically shown a moderate positive correlation with Bitcoin during short-term market moves, making BTC's direction an important external factor.
Cardano Glossary
Ascending Trendline: A rising line connecting a series of higher lows, used to track the pace and structure of an uptrend.
Fair Value Gap (FVG): A price imbalance left behind by a sharp move, often revisited later as a zone of interest for buyers or sellers.
Higher High: A price peak that sits above the previous swing high, generally read as a sign an uptrend is continuing.
Liquidation: What happens when a leveraged trade gets forcibly closed because the trader ran out of margin to keep it open.
Expert View
The higher high formed on the third trendline tap is the more encouraging detail here, since it shows buyers have been willing to pay up rather than just defend the same levels.
The current test inside the $0.1653 to $0.1631 fair value gap is the next real checkpoint for that structure.
A hold here keeps the path toward $0.1744 and $0.1807 open, while a confirmed close below $0.1604 would suggest the trendline has run out of steam, with $0.1578 and $0.1553 next in focus.
Given how cleanly the last setup resolved, as detailed in our ADA recovery continued or faded analysis, this trendline test is worth watching closely over the next few sessions.
Disclaimer: This article is for informational purposes only and should not be considered financial advice. Cryptocurrency markets are highly volatile, and price predictions are not guaranteed. Please do your own research before making any investment decisions.
0
0


 Manage all your crypto, NFT and DeFi from one place
Securely connect the portfolio you’re using to start.


0
0


0
0