Bitcoin Snaps 5-Month Losing Streak But April Opens With Fresh Volatility

0
0
Bitcoin (BTC) closed March with a 1.8% gain. This marked its first positive month since September 2025 and a break from five consecutive red monthly candles.
April has started on a volatile note with the largest cryptocurrency experiencing modest losses.
Seasonality Versus Reality
BeInCrypto Markets data showed that the cryptocurrency traded at $67,630 at press time in early Asian trading hours.
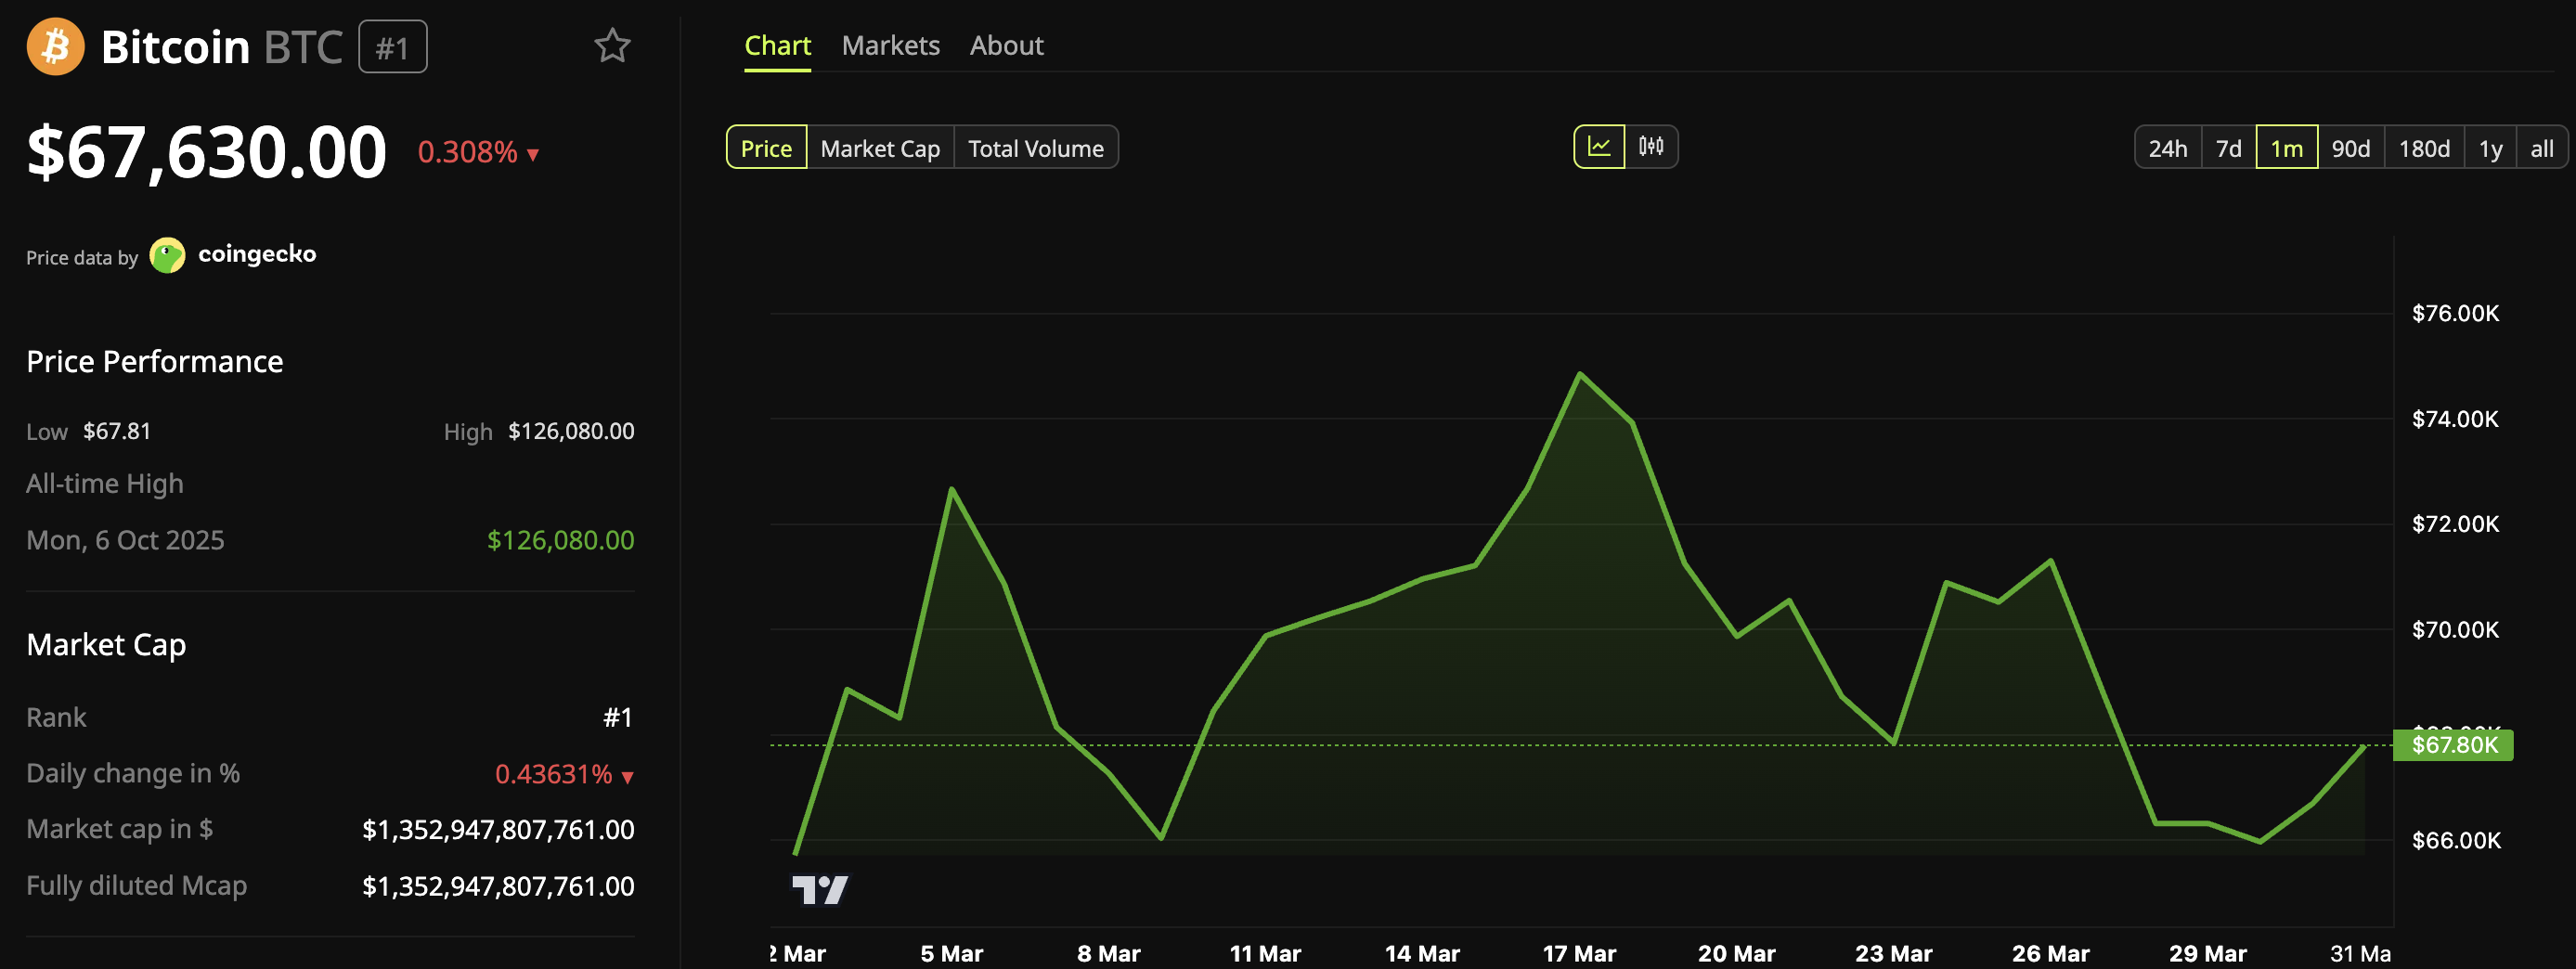 Bitcoin (BTC) Price Performance. Source: BeInCrypto Markets
Now, April has historically been a positive month for BTC, with an average return of 12.1% and a median of 5.04%. Yet the asset has consistently diverged from those trends since late 2025.
January and February posted losses of 10.1% and 14.9%, respectively, both well below their long-term averages. March’s slim gain did little to offset the damage.
Follow us on X to get the latest news as it happens
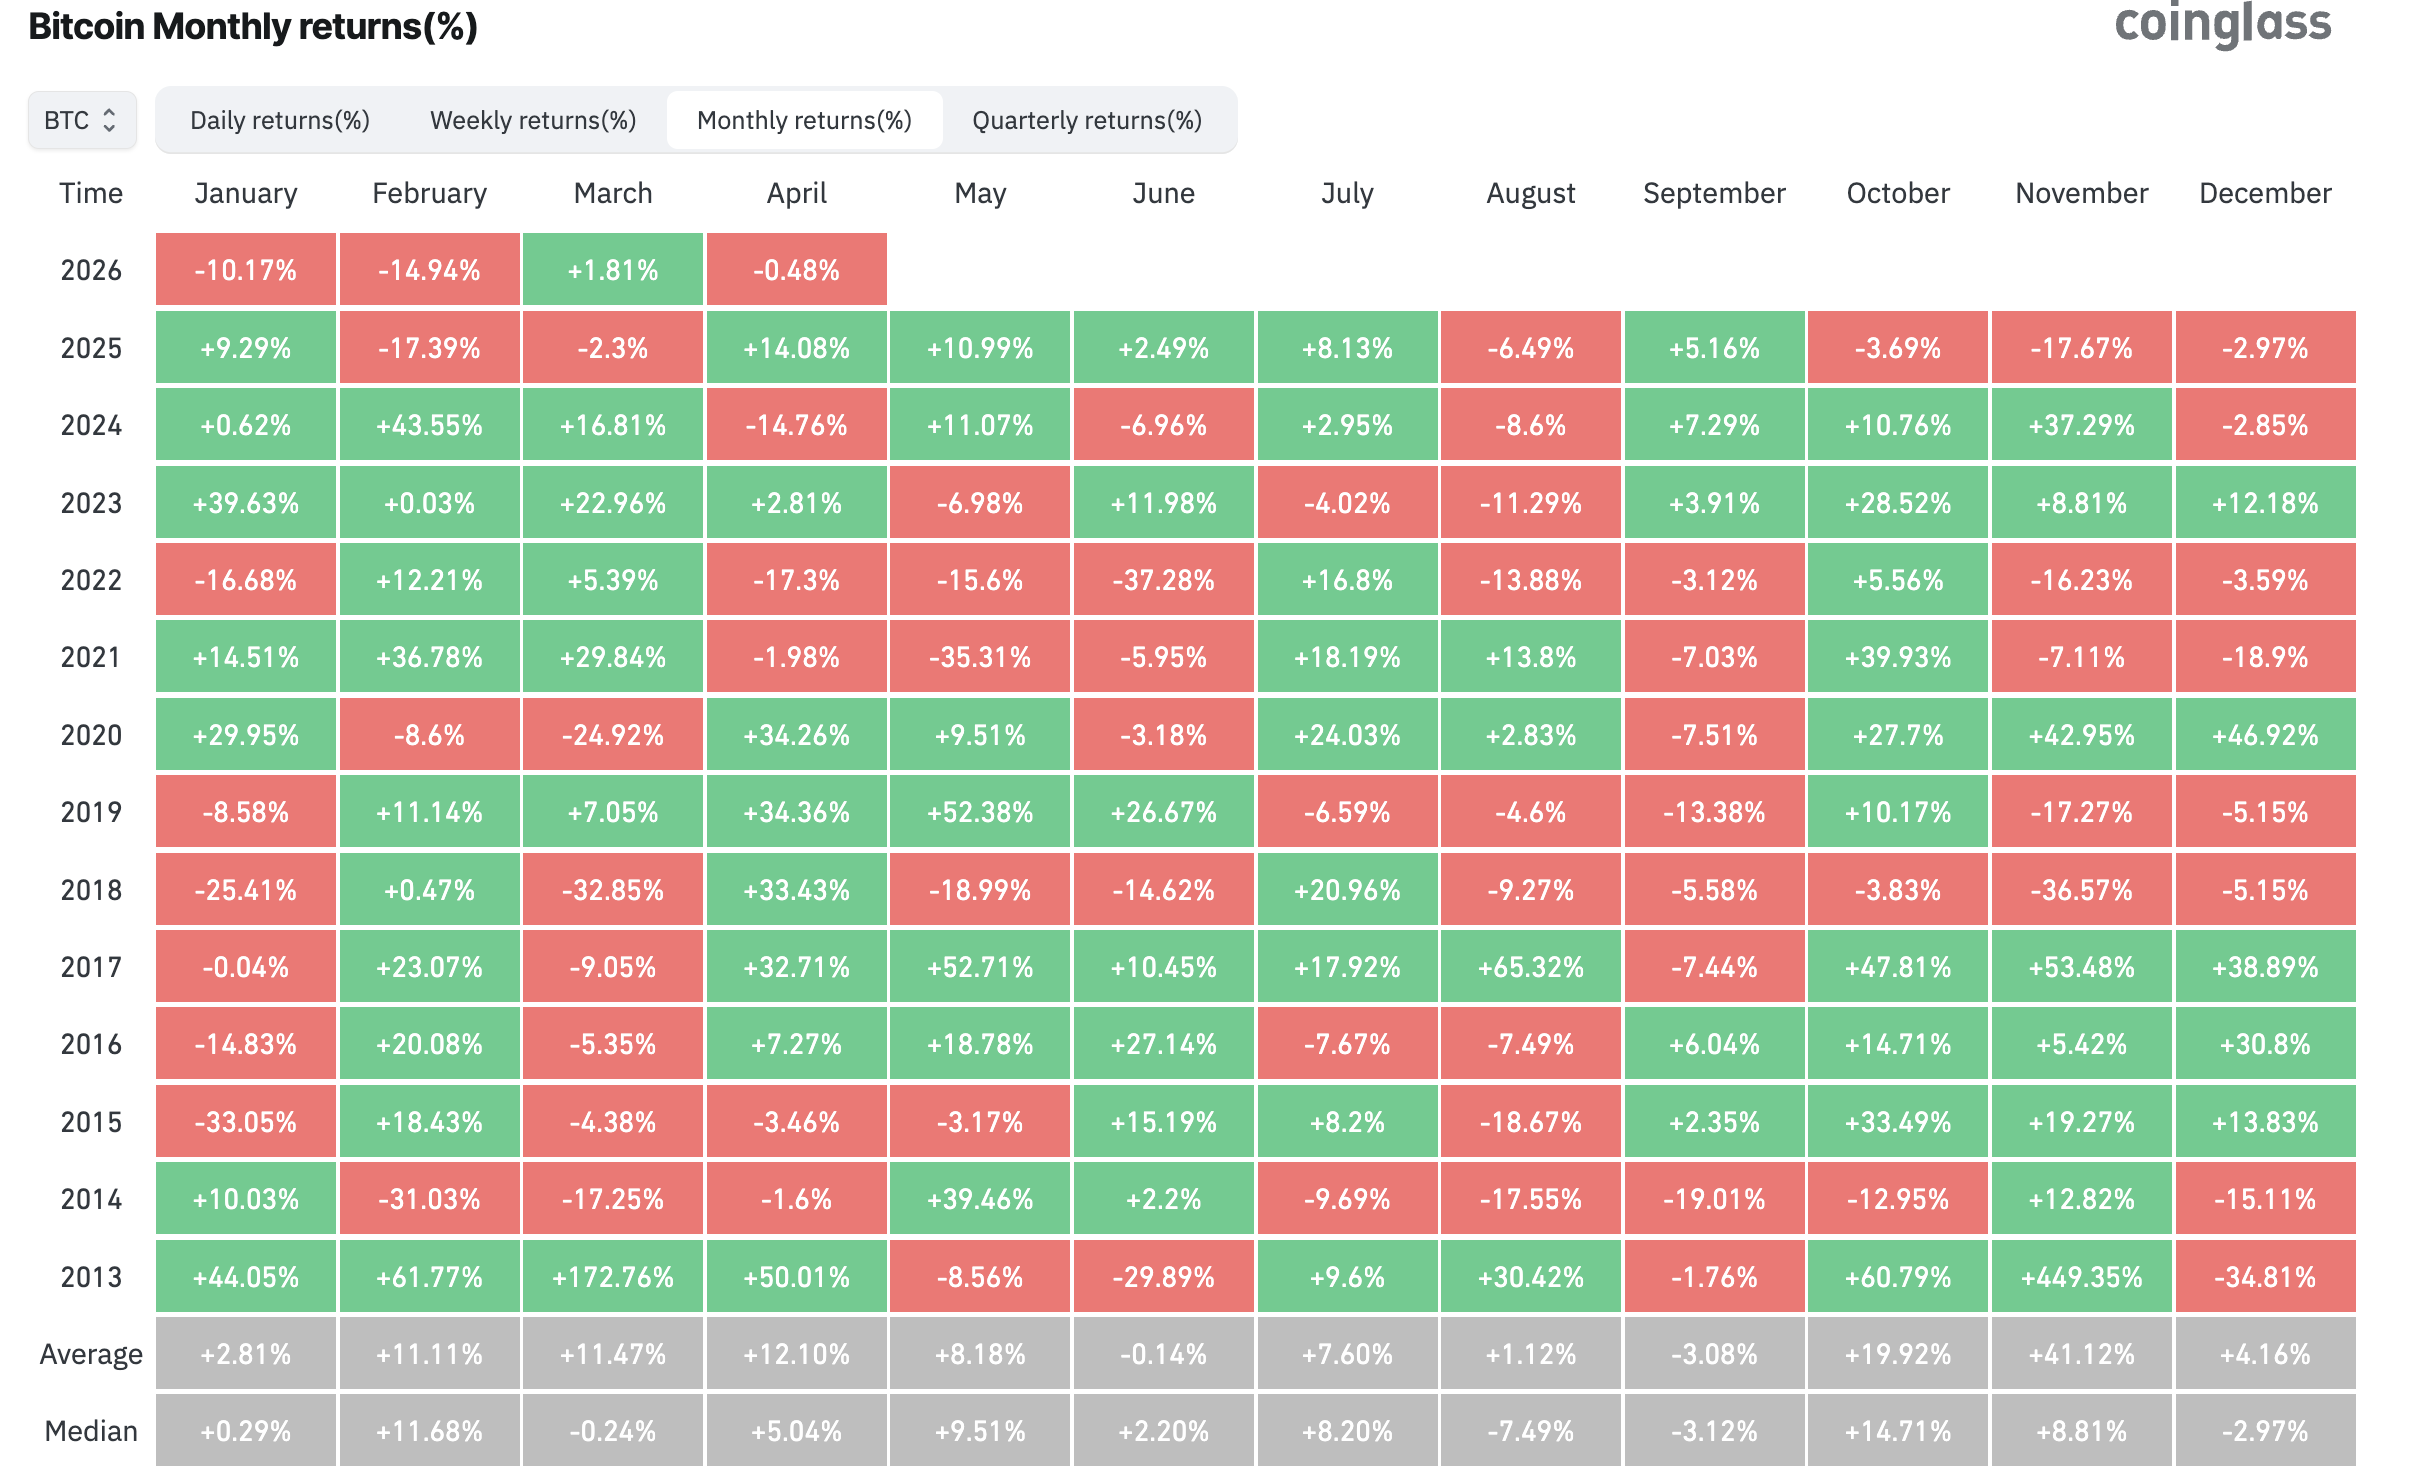 Bitcoin Monthly Returns. Source: Coinglass
Bitcoin’s March Recovery Meets April Uncertainty
With geopolitical and macro uncertainty clouding the outlook, seasonality offers limited guidance. With many now viewing the largest cryptocurrency as in a bear market, what comes next for Bitcoin in April?
On the geopolitical front, Binance Research suggested that concrete US-Iran ceasefire signals could extend crypto’s recovery, with higher-beta assets like Ethereum (ETH) potentially outperforming BTC.
“Caution is still warranted: Iran says there are only ‘message exchanges,’ not formal negotiations, Israel’s objectives remain more aggressive than Washington’s, and the IRGC’s threat against major U.S. tech firms remains a meaningful tail risk,” Binance Research wrote.
On the technical front, CryptosRus highlighted that copper hitting cycle lows while gold’s rate of change peaked preceded BTC surges in both 2016 and 2020.
“Today’s macro conditions align closely with those setups, even as market sentiment lags behind. The market hasn’t priced this convergence in yet,” the post read.
However, others maintain a more cautious outlook. Joao Wedson, CEO of Alphractal, observed that BTC’s cycle top occurred 534 days after the April 2024 halving, the shortest cycle top to date.
“This decaying pattern across cycles suggests the historical bottom may occur between 912 and 922 days after the Halving. That points to a bottom in late September or early October 2026,” he stated.
CryptoQuant’s models align with that timeline. The firm estimates the market could bottom between June and December 2026, with September through November as the most likely window.
With many suggesting the bottom could lie around or below $40,000, it indicates the possibility of further declines in the coming months.
Subscribe to our YouTube channel to watch leaders and journalists provide expert insights
0
0


 Manage all your crypto, NFT and DeFi from one place
Securely connect the portfolio you’re using to start.


0
0

0
0

0
0